Summary for survey of neural networked-based cancer prediction models from microarray data
Presented by
Rao Fu, Siqi Li, Yuqin Fang, Zeping Zhou
Introduction
Microarray technology is widely used in analyzing genetic diseases since it can help researchers to detect genetic information rapidly. In the study of cancer, the researchers use this technology to compare normal and abnormal cancerous tissues so that they can understand better about the pathology of cancer. However, what might affect the accuracy and computation time of this cancer model is the high dimensionality of the gene expressions. To cope with this problem, we need to use the feature selection method or feature creation method. One of the most powerful methods in machine learning is neural networks. In this paper, we will review the latest neural network-based cancer prediction models by presenting the methodology of preprocessing, filtering, prediction, and clustering gene expressions.
Background
Neural Network
Neural networks are often used to solve non-linear complex problems. It is an operational model consisting of a large number of neurons connected to each other by different weights. In this network structure, each neuron is related to an activation function. The difference between the output of the neural network and the desired output is what we called error.
Backpropagation mechanism is one of the most commonly used algorithms in solving neural network problems. By using this algorithm, we optimize the objective function by propagating back the generated error through the network to adjust the weights.
In the next sections, we will use the above algorithm but with different network architectures and different number of neurons to review the neural network-based cancer prediction models for learning the gene expression features.
Cancer prediction models
High dimensionality and the spatial structure are the two main factors that can affect the accuracy of the cancer prediction models. They add irrelevant noisy features to our selected models. We have 3 ways to determine the accuracy of a model.
The first is called ROC curve. It reflects the sensitivity of the response to the same signal stimulus under different criteria. To test its validity, we need to consider it with the confidence interval. Usually, a model is good one when its ROC is greater than 0.7. Another way to measure the performance of a model is to use CI, which explains the concordance probability of the predicted and observed survival. The closer its value to 0.7, the better the model is. The third measurement method is using the Brier score. A brier score measures the average difference between the observed and the estimated survival rate in a given period of time. It ranges from 0 to 1, and a lower score indicates higher accuracy.
Neural network-based cancer prediction models
By performing an extensive search relevant to neural network-based cancer prediction using Google scholar and other electronic databases namely PubMed and Scopus with keywords such as “Neural Networks AND Cancer Prediction” and “gene expression clustering”, the chosen papers covered cancer classification, discovery, survivability prediction and the statistical analysis models. The following figure 1 shows a graph representing the number of citations including filtering, predictive and clustering for chosen papers. 
Datasets and preprocessing
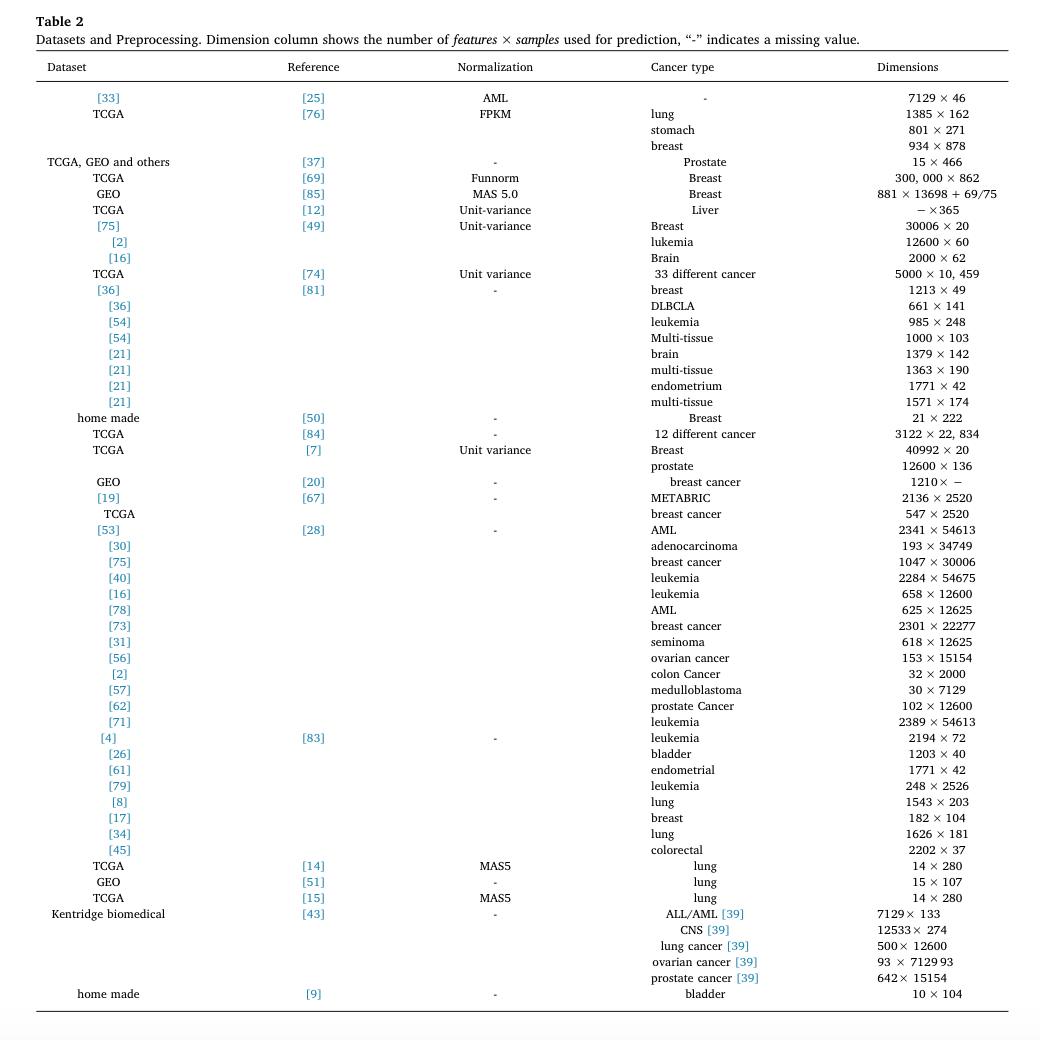
Most studies investigating automatic cancer prediction and clustering used datasets such as the TCGA, UCI, NCBI Gene Expression Omnibus and Kentridge biomedical databases. There are a few of techniques used in processing dataset including removing the genes that have zero expression across all samples, Normalization, filtering with p value > 10^-05 to remove some unwanted technical variation and log2 transformations. Statistical methods, neural network, were applied to reduce the dimensionality of the gene expressions by selecting a subset of genes. Principle Component Analysis (PCA) can also be used as an initial preprocessing step to extract the datasets features. The PCA method linearly transforms the dataset features into lower dimensional space without capturing the complex relationships between the features. However, simply removing the genes that were not measured by the other datasets could not overcame the class imbalance problem. In that case, one research used Synthetic Minority Class Over Sampling method to generate synthetic minority class samples, which may lead to sparse matrix problem. Clustering was also applied in some studies for labeling data by grouping the samples into high-risk, low-risk groups and so on.
The following table presents the dataset used by considered reference, the applied normalization technique, the cancer type and the dimensionality of the datasets.

Neural network architecture
Most recent studies reveal that filtering, predicting methods and cluster methods are used in cancer prediction. For filtering, the resulted features are used with statistical methods or machine learning classification and cluster tools such as decision trees, K Nearest Neighbor and Self Organizing Maps(SOM) as figure 2 indicates.
All neural network’s neurons work as feature detectors that learn the input’s features. For our categorization into filtering, predicting and clustering methods was based on the overall rule that a neural network performs in the cancer prediction method. Filtering methods are trained to remove the input’s noise and to extract the most representative features that best describe the unlabeled gene expressions. Predicting methods are trained to extract the features that are significant to prediction, therefore its objective functions measure how accurately the network is able to predict the class of an input. Clustering methods are trained to divide unlabeled samples into groups based on their similarities.