Uncategorized files
Jump to navigation
Jump to search
Showing below up to 100 results in range #501 to #600.
-
 DBIAPAVUCNN figure 4.png 1,057 × 822; 93 KB
-
 DBIAPAVUCNN figure 5.png 859 × 379; 81 KB
-
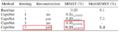
 DBIAPAVUCNN table 1.png 1,043 × 190; 26 KB
-
 DBIAPAVUCNN table 10.png 745 × 258; 49 KB
-
 DBIAPAVUCNN table 2.png 1,182 × 635; 484 KB
-
 DBIAPAVUCNN table 3.png 1,191 × 332; 76 KB
-
 DBIAPAVUCNN table 4.png 1,221 × 325; 128 KB
-
 DBIAPAVUCNN table 5.png 652 × 281; 38 KB
-
 DBIAPAVUCNN table 6.png 589 × 285; 30 KB
-
 DBIAPAVUCNN table 7.png 1,060 × 239; 30 KB
-
 DBIAPAVUCNN table 9.png 822 × 565; 46 KB
-
 DB F1.png 1,730 × 822; 337 KB
-
 DB F2.png 1,770 × 634; 191 KB
-
 DB F3.png 944 × 1,124; 608 KB
-
 DB F7.png 1,572 × 644; 263 KB
-
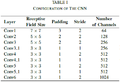
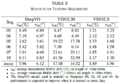
 DCNN.png 1,022 × 348; 74 KB
-
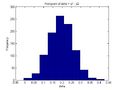
 DCNN dataset histogram.png 1,321 × 516; 84 KB
-
 DDRFigure3n4.png 1,236 × 428; 185 KB
-
 DDRFigure5.png 1,026 × 356; 113 KB
-
 DDRFigure6.png 622 × 404; 113 KB
-
 DDRFigure7.png 516 × 730; 133 KB
-
 DDRFigure8.png 708 × 502; 224 KB
-
 DDRTable1.png 658 × 316; 48 KB
-
 DJB CIFAR10.png 1,880 × 460; 183 KB
-
 DL STAT946 PPT AravindRavi.pdf 0 × 0; 1.86 MB
-
 DNI.png 739 × 258; 55 KB
-
 DPR datasets.png 1,022 × 618; 110 KB
-
 DQN.png 2,631 × 1,471; 514 KB
-
 DQN arch.png 1,601 × 551; 375 KB
-
 DRBC Architecture.png 1,079 × 313; 68 KB
-
 DRBC AvgLogitDiff.png 831 × 298; 55 KB
-
 DRBC Decoder.png 587 × 261; 41 KB
-
 DRBC Dimension.png 924 × 362; 122 KB
-
 DRBC Figure 1.png 1,087 × 319; 123 KB
-
 DRBC Reconstruction.png 817 × 217; 59 KB
-
 DRBC TrainLossIter.png 479 × 296; 41 KB
-
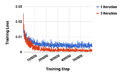
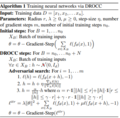 DROCCtrain.png 376 × 371; 73 KB
-
 Data1.jpg 678 × 376; 148 KB
-
 Data2.jpg 584 × 358; 148 KB
-
 Data3.jpg 655 × 260; 54 KB
-
 Data441.png 396 × 276; 37 KB
-
 Data Analytics Process Flow.PNG 467 × 535; 212 KB
-
 Data Attributes Types and Description.png 588 × 372; 57 KB
-
 Data Preprocessing.png 746 × 237; 31 KB
-
 Data noise.jpeg 454 × 280; 13 KB
-
 Data noise.jpg 454 × 280; 13 KB
-
 Datasets and preprocessing.png 1,040 × 1,040; 190 KB
-
 Datasize.png 324 × 274; 17 KB
-
 Dbn.png 276 × 320; 25 KB
-
 Dcor-1.png 605 × 505; 30 KB
-
 Dcor-2.png 545 × 491; 29 KB
-
 Dec8.png 1,498 × 492; 155 KB
-
 Decision Square.GIF 367 × 313; 3 KB
-
 Decision boundary Joanna.jpg 445 × 342; 23 KB
-
 Decision trees.GIF 367 × 326; 3 KB
-
 Decoder.png 700 × 313; 46 KB
-
 DeepBeliefNet derivation.jpg 176 × 319; 7 KB
-
 DeepFool.PNG 789 × 98; 12 KB
-
 DeepNNarchitecture.png 921 × 644; 38 KB
-
 DeepVO Figure 1.png 512 × 122; 31 KB
-
 DeepVO Figure 2.png 512 × 168; 55 KB
-
 DeepVO Figure 3.png 480 × 242; 41 KB
-
 DeepVO Figure 6.png 483 × 476; 65 KB
-
 DeepVO Figure 8.png 1,197 × 762; 166 KB
-
DeepVO Presentation Henry.pdf 0 × 0; 995 KB
-
 DeepVO Table 1.png 448 × 307; 21 KB
-
 DeepVO Table 2.png 477 × 335; 66 KB
-
Deep learning course presentation.pdf 0 × 0; 558 KB
-
 Delta hist.jpg 560 × 420; 18 KB
-
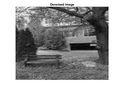 Denoised Wavelet.jpg 840 × 630; 61 KB
-
 Det vs sto.jpg 432 × 213; 18 KB
-
 Detection performance.JPG 1,042 × 226; 62 KB
-
 Dhruv Figure1.png 1,302 × 668; 154 KB
-
 Dhruv Figure2.png 1,296 × 1,512; 362 KB
-
 Dhruv Figure3.png 1,232 × 1,478; 363 KB
-
 Dhruv Figure4.png 1,220 × 1,718; 553 KB
-
 Dhruv Table1.png 1,214 × 632; 196 KB
-
 Dhruv Table2.png 1,252 × 816; 300 KB
-
 Dhruv Table3.png 1,210 × 490; 143 KB
-
 Dhruv Table4.png 1,168 × 506; 132 KB
-
 Di.jpg 219 × 343; 17 KB
-
 Diag1.png 559 × 394; 5 KB
-
 Diagram.jpg 359 × 200; 11 KB
-
 Digits.png 454 × 330; 74 KB
-
 Dimension.JPG 797 × 455; 40 KB
-
 Dimensoin.png 797 × 455; 177 KB
-
 DirGraphObs.png 1,765 × 1,946; 71 KB
-
 DirGraphUnconvert.png 1,838 × 1,817; 66 KB
-
 Dir Tree.png 1,845 × 1,657; 67 KB
-
 Directed.png 453 × 268; 5 KB
-
 Disclda.jpg 216 × 340; 18 KB
-
 Discllda.png 219 × 345; 11 KB
-
 Discrete example.jpg 561 × 420; 15 KB
-
 Discreteinv.jpg 560 × 420; 13 KB
-
 DiscriminativeModel.png 46 × 118; 975 bytes
-
 Distance.png 960 × 720; 93 KB
-
 Distance2.jpg 960 × 720; 25 KB
-
 Distribuation.png 1,125 × 587; 9 KB
-
 Disttool.jpg 567 × 477; 48 KB
-
 DivideMixtable5.PNG 809 × 399; 178 KB


