File list
Jump to navigation
Jump to search
This special page shows all uploaded files.
| Date | Name | Thumbnail | Size | User | Description | Versions |
|---|---|---|---|---|---|---|
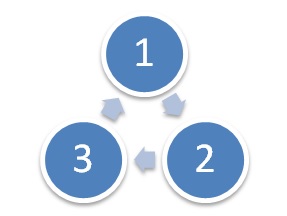
| 20:35, 12 December 2015 | W3.png (file) |  |
10 KB | Drishi | 1 | |
| 15:33, 7 October 2009 | 2-3-qda.png (file) |  |
10 KB | Tbekolay | 1 | |
| 14:18, 6 October 2009 | Qda.gif (file) |  |
10 KB | H23he | 1 | |
| 15:11, 27 November 2015 | Kingma 2014 4.png (file) | 10 KB | Dylandrover | 1 | ||
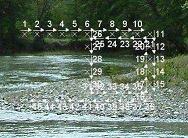
| 17:52, 22 November 2020 | Position.png (file) | 10 KB | X25ling | 1 | ||
| 14:32, 14 March 2018 | WT Fig8.png (file) |  |
10 KB | H5tahir | 1 | |
| 12:07, 10 July 2009 | BM.jpg (file) |  |
10 KB | Sttse | 2 | |
| 10:22, 23 November 2009 | Non-separable.JPG (file) |  |
10 KB | H23he | 1 | |
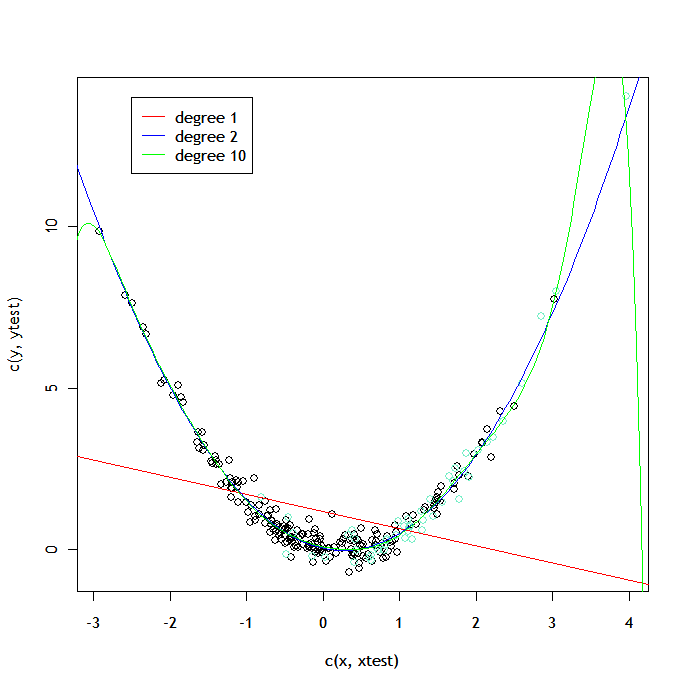
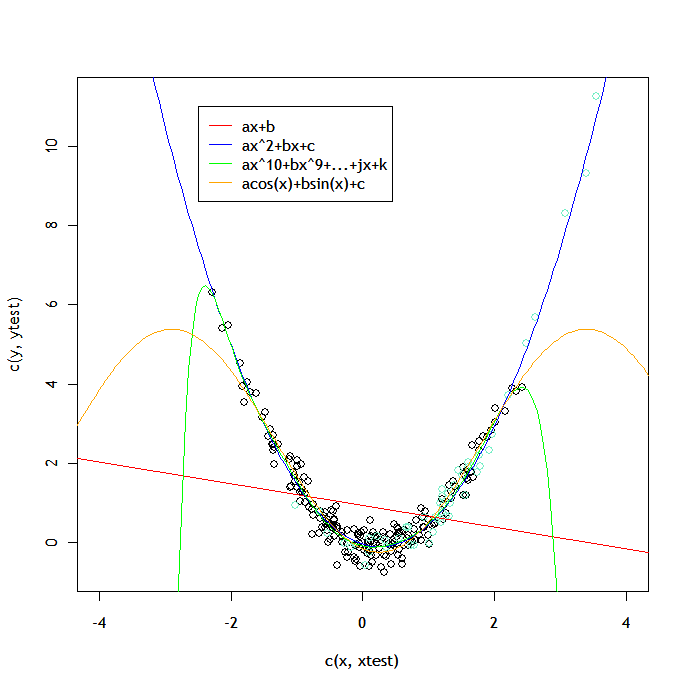
| 17:01, 8 November 2009 | Curvefitting-rex.png (file) |  |
10 KB | Njmurdoc | Fitting degree 1, 2, and 10 polynomials to a randomly generated sample. Black points represent training data, teal represent test data. Y values follow the same function, but x values of training and test data have means 0 and 1 to help separate them. | 1 |
| 11:23, 9 July 2013 | Pagerank.jpg (file) |  |
10 KB | Srkuban | 1 | |
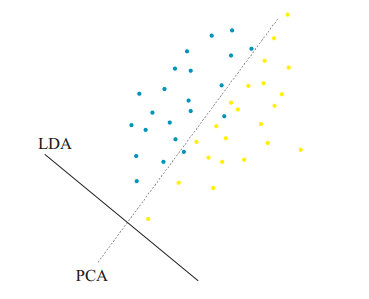
| 17:47, 16 October 2014 | PCA-FDA.PNG (file) |  |
10 KB | AhmedElbagoury | 1 | |
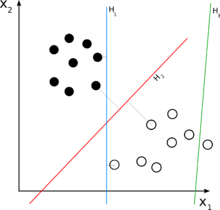
| 03:59, 6 December 2011 | SVM.png (file) |  |
10 KB | Graveend | 1 | |
| 18:15, 9 June 2013 | 2d ex.jpg (file) |  |
10 KB | S27zhu | 1 | |
| 12:58, 23 November 2017 | oflow.png (file) |  |
10 KB | Amanjhunjhunwala | 1 | |
| 15:50, 18 October 2017 | MN2.PNG (file) | 10 KB | Vrrao | 1 | ||
| 22:51, 19 October 2009 | Boundary-lda.png (file) |  |
10 KB | W66li | 2 | |
| 19:33, 18 December 2010 | C5p3.jpg (file) | 10 KB | Y24Sun | 1 | ||
| 02:50, 15 March 2018 | formula2.png (file) | 10 KB | Y53zou | 1 | ||
| 13:33, 10 July 2009 | RBM.jpg (file) |  |
10 KB | Sttse | 1 | |
| 21:09, 12 November 2017 | MRL1.png (file) | 10 KB | Amanjhunjhunwala | 1 | ||
| 00:08, 2 March 2018 | seq.PNG (file) |  |
11 KB | X249wang | 1 | |
| 00:48, 2 March 2018 | seq.png (file) |  |
11 KB | X249wang | 1 | |
| 17:06, 14 November 2018 | policy-extraction.png (file) | 11 KB | X46peng | 1 | ||
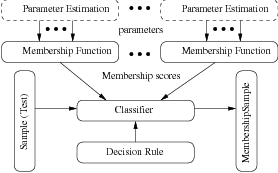
| 14:20, 26 June 2013 | Diagram.jpg (file) |  |
11 KB | Sqmwong | 1 | |
| 22:19, 13 November 2018 | Image of Figure 6b.png (file) |  |
11 KB | Kjibrews | 1 | |
| 18:56, 9 November 2010 | Discllda.png (file) |  |
11 KB | Sseifzad | 1 | |
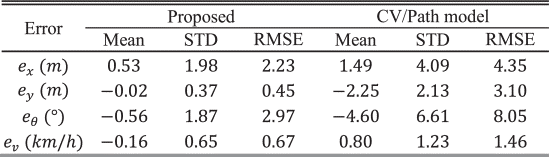
| 17:21, 23 November 2018 | Paper 40 Table 1.png (file) | 11 KB | Aaafify | 1 | ||
| 13:43, 16 March 2018 | eq2.2.png (file) | 11 KB | Z26ye | 1 | ||
| 16:39, 27 October 2011 | X1X2perpBeta.png (file) |  |
11 KB | Kwebster | 1 | |
| 16:37, 27 October 2011 | GeometricView.png (file) |  |
11 KB | Kwebster | 1 | |
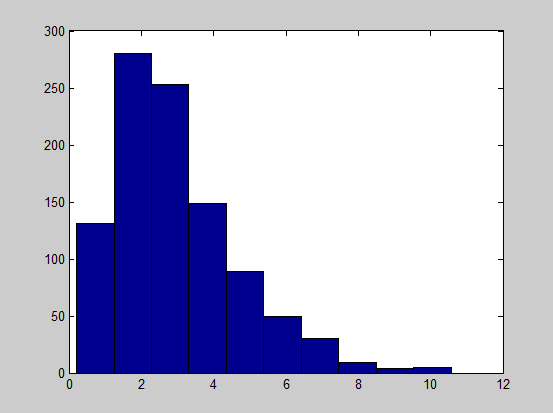
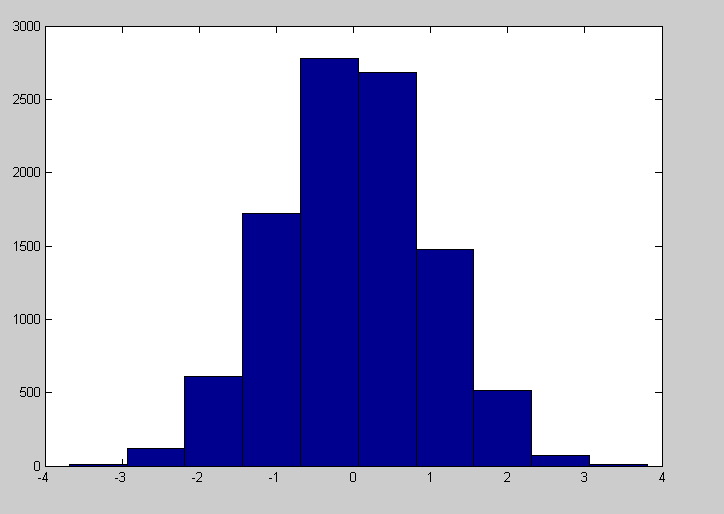
| 20:09, 27 September 2011 | Hist.PNG (file) |  |
11 KB | Tonylee | Sept 27 Hist(x) | 1 |
| 18:14, 27 June 2013 | Eg1.jpg (file) |  |
11 KB | Sqmwong | 1 | |
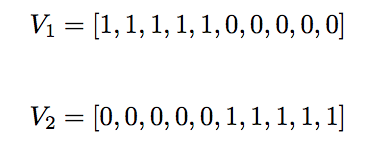
| 01:20, 7 November 2018 | v1v2.png (file) |  |
11 KB | Bbudnara | 1 | |
| 09:44, 8 June 2009 | Image3.jpg (file) |  |
11 KB | Sttse | 2 | |
| 22:24, 30 November 2020 | Figure10.1 YanYu.png (file) |  |
11 KB | Y87yu | 1 | |
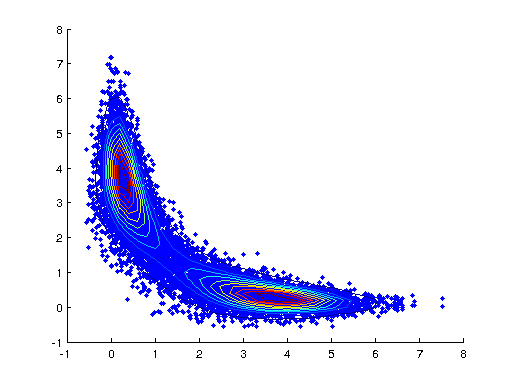
| 23:57, 26 July 2013 | BivariateGibbsContour.png (file) |  |
11 KB | Mwhall | 1 | |
| 22:27, 6 December 2011 | A4q5 5.jpg (file) |  |
11 KB | Yj2xu | 2 | |
| 19:28, 9 December 2010 | Cs2.png (file) |  |
11 KB | Afibrahim | 1 | |
| 22:27, 6 December 2011 | A4q5 6.jpg (file) |  |
11 KB | Yj2xu | 2 | |
| 13:38, 12 December 2015 | CONTINUOUS.PNG (file) |  |
11 KB | Rtwang | 1 | |
| 14:55, 30 September 2011 | Hist standard normal.PNG (file) |  |
11 KB | Ajprins | 2 | |
| 21:38, 14 November 2018 | Carlini.PNG (file) | 11 KB | Skoundin | 1 | ||
| 20:09, 30 October 2018 | AR Fig2b.png (file) |  |
11 KB | A22ravi | 1 | |
| 11:58, 2 December 2014 | Normal mix.png (file) |  |
11 KB | Tyou | 1 | |
| 00:51, 11 November 2011 | Sum fig1.JPG (file) |  |
11 KB | Tameem | 1 | |
| 13:23, 9 July 2013 | Pagerank5.jpg (file) |  |
11 KB | Dgbarty | 2 | |
| 22:29, 6 December 2011 | A4q5 9.jpg (file) |  |
11 KB | Yj2xu | 2 | |
| 17:24, 8 November 2009 | Curvefitting-rex2.png (file) |  |
11 KB | Njmurdoc | Fitting degree 1, 2, and 10 polynomials, and trigonometric functions to a randomly generated quadratic sample. Black points represent training data, teal represent test data. Y values follow the same function, but x values of training and test data have | 1 |
| 01:04, 23 October 2010 | Bpl.png (file) |  |
11 KB | NickChurch | 1 | |
| 01:24, 26 November 2018 | network1.PNG (file) |  |
11 KB | Kb7lee | 1 |