File:Overfitting-model.png
No higher resolution available.
Overfitting-model.png (560 × 420 pixels, file size: 5 KB, MIME type: image/png)
x=20*rand(9,1); x=sort(x); x=[0;x;20]; e=rand(size(x,1),1); plot(x,2*x+10*e,'*','MarkerEdgeColor','k'); hold on plot(x,2*x+10*e,'-.','MarkerEdgeColor','k'); hold on; plot(nx,2*nx+5 ,'-r'); h = legend('The training data set','An overfitting model', 'A line' ,3, 'Location', 'NorthWest');
File history
Click on a date/time to view the file as it appeared at that time.
| Date/Time | Thumbnail | Dimensions | User | Comment | |
|---|---|---|---|---|---|
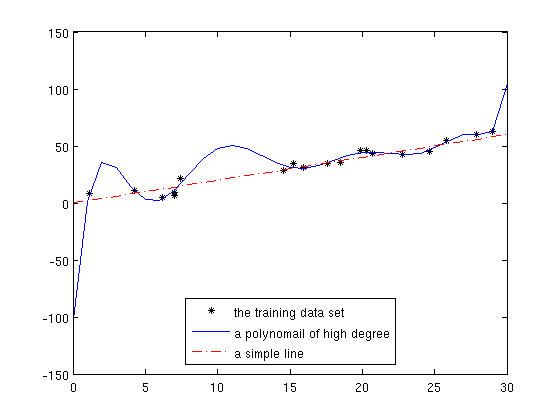
| current | 16:07, 6 November 2009 | | 560 × 420 (5 KB) | Mderakhs (talk | contribs) | num_points=20; amp=30; error_amp=15; x=unique(amp*rand(num_points,1)); num_points=size(x,1); e=error_amp*rand(num_points,1)-error_amp/2; y=2*x+e; n=10; p = polyfit(x,y,n); newx=[0:amp]; newy=polyval(p,newx); hold off; plot(x,y,'*','MarkerEdgeColor','k'); |
| 12:28, 6 November 2009 | 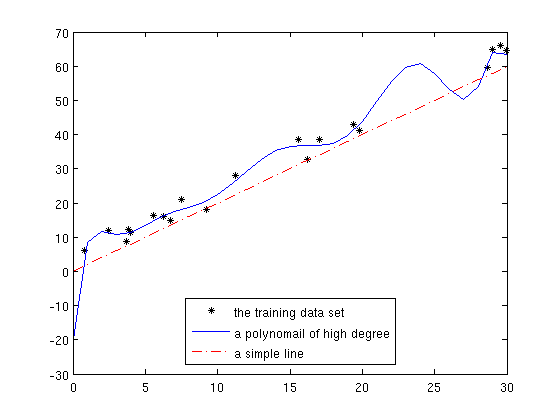 | 560 × 420 (6 KB) | Mderakhs (talk | contribs) | num_points=20; amp=30; x=unique(amp*rand(num_points,1)); num_points=size(x,1); e=10*rand(num_points,1)-2.5; y=2*x+e; n=10; p = polyfit(x,y,n); newx=[0:amp]; newy=polyval(p,newx); hold off; plot(x,y,'*','MarkerEdgeColor','k'); hold on; plot(newx,newy, '-' | |
| 01:12, 2 November 2009 | 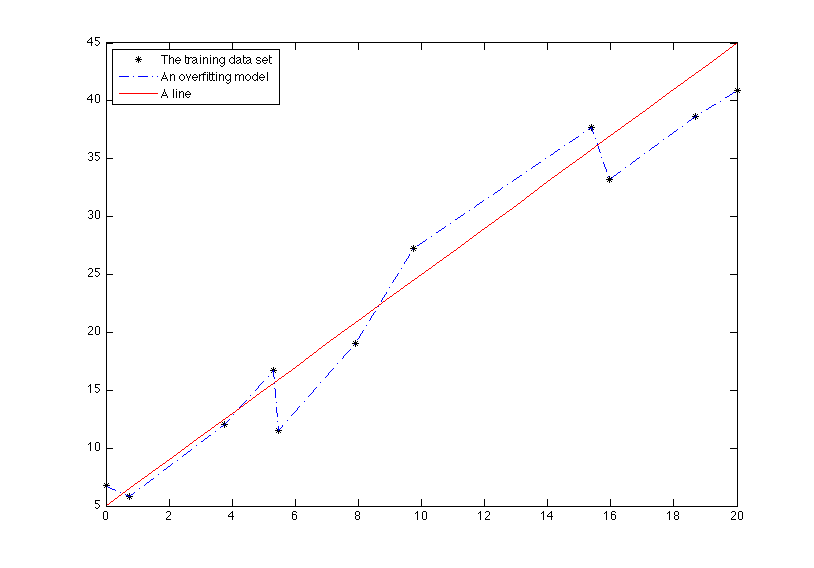 | 814 × 568 (8 KB) | Mderakhs (talk | contribs) | x=20*rand(9,1); x=sort(x); x=[0;x;20]; e=rand(size(x,1),1); plot(x,2*x+10*e,'*','MarkerEdgeColor','k'); hold on plot(x,2*x+10*e,'-.','MarkerEdgeColor','k'); hold on; plot(nx,2*nx+5 ,'-r'); h = legend('The training data set','An overfitting model', 'A lin |
You cannot overwrite this file.
File usage
There are no pages that use this file.