File:Figure 10.JPG
Size of this preview: 769 × 599 pixels. Other resolution: 1,436 × 1,119 pixels.
Original file (1,436 × 1,119 pixels, file size: 75 KB, MIME type: image/jpeg)
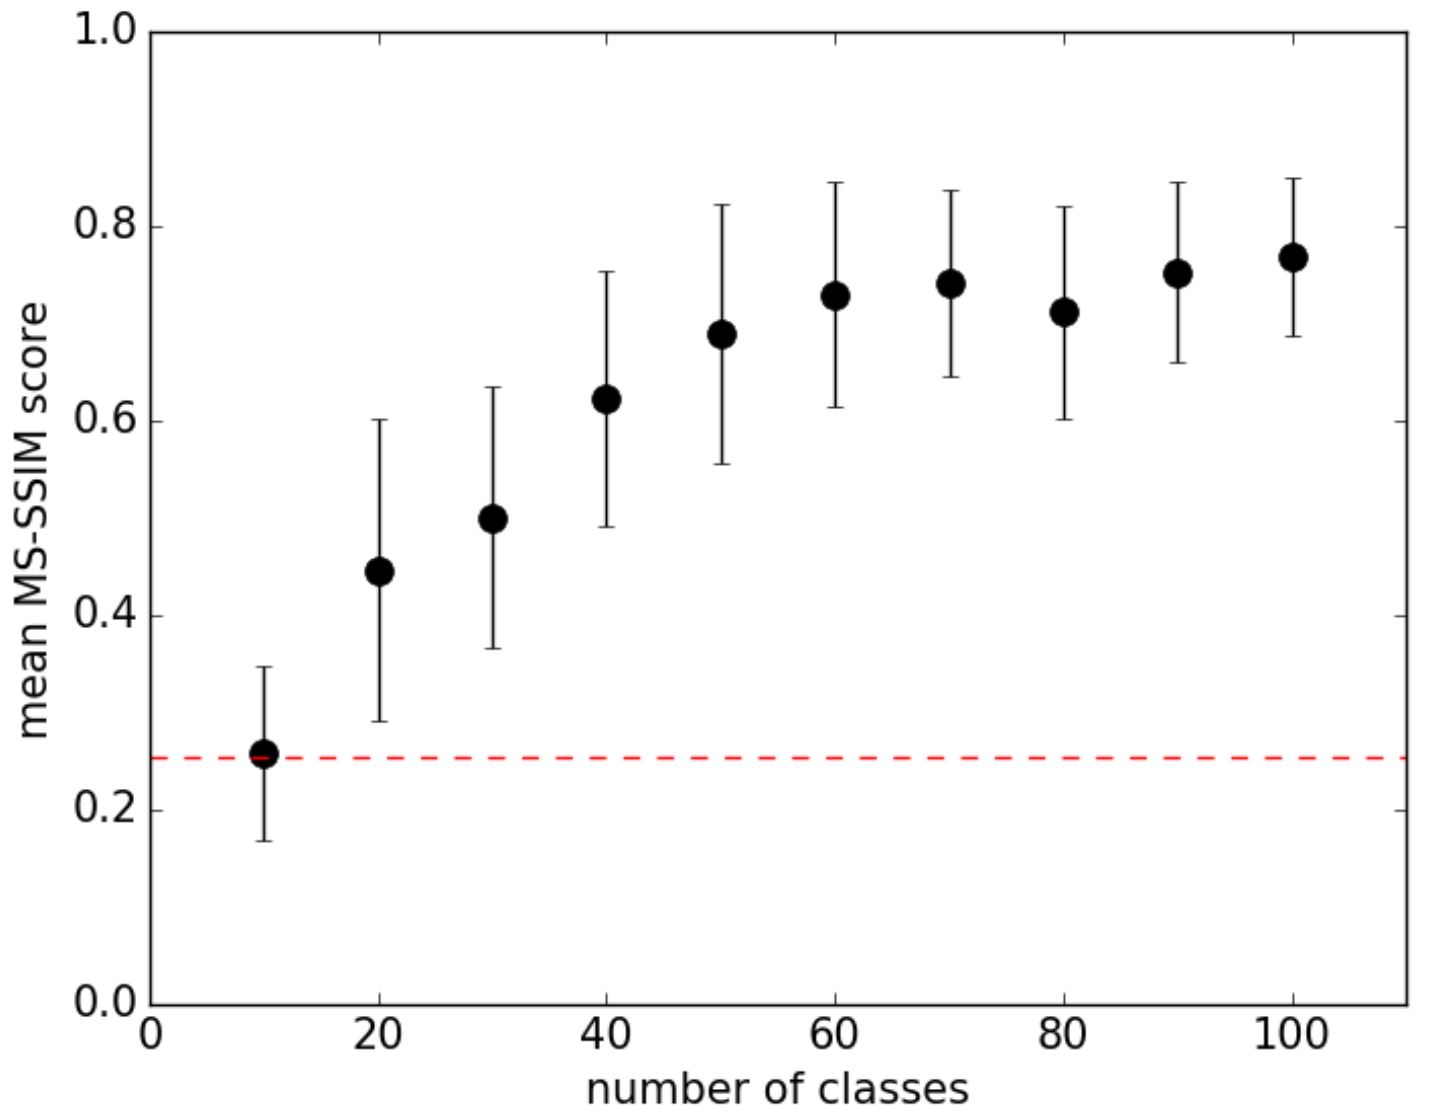
Mean MS-SSIM score on generated images when the number of of classes in each model is increased.
File history
Click on a date/time to view the file as it appeared at that time.
| Date/Time | Thumbnail | Dimensions | User | Comment | |
|---|---|---|---|---|---|
| current | 14:54, 19 November 2017 | | 1,436 × 1,119 (75 KB) | Mike Rudd (talk | contribs) | Mean MS-SSIM score on generated images when the number of of classes in each model is increased. |
You cannot overwrite this file.
File usage
The following page uses this file: