Bayesian Network as a Decision Tool for Predicting ALS Disease: Difference between revisions
| (103 intermediate revisions by the same user not shown) | |||
| Line 3: | Line 3: | ||
== Introduction == | == Introduction == | ||
In order to propose the best decision tool for Amyotrophic Lateral Sclerosis (ALS) prediction, Hasan Aykut et al. presents in | In order to propose the best decision tool for Amyotrophic Lateral Sclerosis (ALS) prediction, Hasan Aykut et al. presents in this paper a comparative empirical study of the predictive performance of 8 supervised Machine Learning classifiers, namely, Bayesian Networks, Artificial Neural Networks, Logistic Regression, Naïve Bayes, J48, Support Vector Machines, KStar, and K-Nearest Neighbor. With a dataset consisting of blood plasma protein level and independent personal features, for each classifier they predicted ALS patients and found that Bayesian Networks offer the best results based on various metrics such as accuracy (88.7%) and 97% for Area Under the Curve (AUC). | ||
Our summary of the paper commences with the review of previous works underpinning its motivation, next we | Our summary of the paper commences with the review of previous works underpinning its motivation, next we present the dataset and the methodological approach that the authors used, then we analyze the results which is finally followed by the conclusion. | ||
== Previous Work and Motivation == | == Previous Work and Motivation == | ||
| Line 11: | Line 11: | ||
ALS is a nervous system disease that progressively affects brain nerve cells and spinal cord, impacting the patient's upper and lower motor autonomy in the loss of muscle control. Its origin is still unknown, though in some instances it is thought to be hereditary. Sadly, at this point of time, it is not curable and the progressive degeneration of the muscles cannot be halted once started [1] and inexorably results in patient's passing away within 2-5 years [2]. | ALS is a nervous system disease that progressively affects brain nerve cells and spinal cord, impacting the patient's upper and lower motor autonomy in the loss of muscle control. Its origin is still unknown, though in some instances it is thought to be hereditary. Sadly, at this point of time, it is not curable and the progressive degeneration of the muscles cannot be halted once started [1] and inexorably results in patient's passing away within 2-5 years [2]. | ||
The symptoms that ALS patients exhibit are not distinctively unique to ALS, as they are similar to a host of other neurological disorders. Furthermore, because the impact on patient's motor skill is usually not noticeable in early stage [3], diagnosis at that time is a challenge. One of the main diagnosis protocols, known as El Escorial criteria, involves a battery of tests taking 3-6 months. This is a considerable amount of time since a quicker diagnosis would allow earlier medical monitoring, conducive to patient's life conditions improvement with the possibility | The symptoms that ALS patients exhibit are not distinctively unique to ALS, as they are similar to a host of other neurological disorders. Furthermore, because the impact on patient's motor skill is usually not noticeable in early stage [3], diagnosis at that time is a challenge. One of the main diagnosis protocols, known as El Escorial criteria, involves a battery of tests taking 3-6 months. This is a considerable amount of time since a quicker diagnosis would allow earlier medical monitoring, conducive to patient's life conditions improvement with the possibility of an extended survival. | ||
Given the need of a more timely but effective diagnosis, the authors of this paper proposed to bring to contribution the application of Machine Learning to identify among a list of candidates, the approach that yields the most accurate prediction. | Given the need of a more timely but effective diagnosis, the authors of this paper proposed to bring to contribution the application of Machine Learning to identify among a list of candidates, the approach that yields the most accurate prediction. | ||
== Dataset == | == Dataset == | ||
The table below shows | The table below shows an overview of the patient's features for the data which were collected in a prior experimental research. There are overall 204 data points of which about 50% are from ALS patients and the rest consists of Parkinson's patients, Neurological Control group patients, and also healthy participants Control group. | ||
[[File:Table 1.png|center]] | |||
== Study Methods == | |||
Figure 1 below shows the global architecture of the modelling process in the comparative machine learning performance study. Though all parts are important, the last two are much more of interest to us here and we focus on those. | |||
[[File:Aykut et al Figure 1.png|center]] | |||
<div align="center">Figure 1: Modelling process with machine learning methods</div> | |||
We provide here an overview of Bayesian Networks, since in the setting of our course it was not covered. Bayesian Networks are graph based statistical models that represent probabilistic relationships among variables and are mathematically formulated as: | |||
[[File: BN Formula.png | center]] | |||
[ | They are also referred to as Directed Acyclic Graphs (DAG), i.e., graphs composed of nodes representing variables and arrows representing the direction of the dependency. BN are easily interpretable, especially for non-technical audience and are well adopted in the areas of biology and Medicine [4-5]. | ||
Generally, the choice of an algorithm is informed by the nature of the dataset which also suggests the most appropriate performance evaluation criteria of the technique. For instance, the dataset in this study is characterized on one hand by 4 classes (vs. the typical 2-class) and on the other by the unbalance in the number of participants in each group. Because of this latter characteristic, Hasan Aykut et al. included in their evaluation criteria the Geometric Mean and the Youden' index, since these 2 are known to resist the impact of unbalanced data on the performance evaluation. Table 2 below shows the evaluation criteria formulae. | |||
[[File: Criteria Formula.png | center]] | |||
== Results Presentation == | |||
The resulting Bayesian Network from the study is presented below and visually it shows the dependency of the class prediction, i.e., Patient Type, on all the features, some of which have dependency among themselves as well. For example, we can see that the number of patience is dependent on age. | |||
[[File: BN Network.png | center]] | |||
<div align="center">Figure 2: Bayesian Network model of the dataset</div> | |||
Table 3 summarizes the performance comparison of all 8 techniques through the lens of the 11 evaluation criteria and Bayesian Network comes top in all criteria, including 88.2% on Geometric Mean, 88.3% on Youden's index, 88.7% on accuracy and 97% with the weighted ROC. | |||
[[File: Performance Comparison Table.png | center]] | |||
== | == Conclusion and Critiques == | ||
In this study, Hasan Aykut et al. conducted a technical study to evaluate and determine among 8 algorithms which is the best decision tool for ALS prediction. Eleven evaluation criteria were used and Bayesian Network produced the best results with among other measures, 88.7% on Accuracy and 97% on ROC that is more adequate for unbalanced datasets. In addition to achieving the best predictive performance in this study, Bayesian Networks are also easily interpretable by non-technical audience, justifying its adoption in domains such as biology and medicine. | |||
From our perspective, given the nature of the dataset, which not only is unbalanced but also has 4 different classes, we would suggest Convolutional Neural Network as another method to explore further accuracy improvement though interpretability in that case would be more of a challenge. Because to date its origin is still unknown and very difficult to diagnose in early stage, it is a very important area of research that should rally more members of the Machine Learning and Artificial Intelligence community into further collaboration with the medical community in order to develop a more effective and rapid diagnostic decision tool for the detection of this neurological disorder at its inception as this could contribute to determining its origin and therefore allows for the development of preventative and curative measures. | |||
== References == | == References == | ||
[1] Rowland, L.P.; Shneider, N.A. Amyotrophic Lateral Sclerosis. N. Engl. J. Med. 2001, 344, 1688–1700. [[https://www.nejm.org/doi/full/10.1056/NEJM200105313442207 CrossRef]] [[https://pubmed.ncbi.nlm.nih.gov/11386269/ PubMed]] | [1] Rowland, L.P.; Shneider, N.A. Amyotrophic Lateral Sclerosis. N. Engl. J. Med. 2001, 344, 1688–1700. [[https://www.nejm.org/doi/full/10.1056/NEJM200105313442207 CrossRef]] [[https://pubmed.ncbi.nlm.nih.gov/11386269/ PubMed]] | ||
[2] | [2] Hardiman, O.; van den Berg, L.H.; Kiernan, M.C. Clinical Diagnosis and Management of Amyotrophic Lateral Sclerosis. Nat. Rev. Neurol. 2011, 7, 639–649. [[http://doi.org/10.1038/nrneurol.2011.153 CrossRef]] [[http://www.ncbi.nlm.nih.gov/pubmed/21989247 PubMed]]. | ||
[ | |||
[ | [3] Swinnen, B.; Robberecht, W. The Phenotypic Variability of Amyotrophic Lateral Sclerosis. Nat. Rev. Neurol. 2014, 10, 661. [[http://doi.org/10.1038/nrneurol.2014.184 CrossRef]] [[http://www.ncbi.nlm.nih.gov/pubmed/24126629 PubMed]] | ||
[4] Bandyopadhyay, S.; Wolfson, J.; Vock, D.M.; Vazquez-Benitez, G.; Adomavicius, G.; Elidrisi, M.; Johnson, P.E.; OConnor, P.J. Data Mining for Censored Time-to-Event Data: A Bayesian Network Model for Predicting Cardiovascular Risk from Electronic Health Record Data. Data Min. Knowl. Discov. 2015, 29, 1033–1069. [[http://doi.org/10.1007/s10618-014-0386-6 CrossRef]] | |||
[5] Kanwar, M.K.; Lohmueller, L.C.; Kormos, R.L.; Teuteberg, J.J.; Rogers, J.G.; Lindenfeld, J.; Bailey, S.H.; McIlvennan, C.K.; Benza, R.; Murali, S.; et al. A Bayesian Model to Predict Survival after Left Ventricular Assist Device Implantation. JACC Heart Fail. 2018, 6, 771–779. [[http://doi.org/10.1016/j.jchf.2018.03.016 CrossRef]] [[http://www.ncbi.nlm.nih.gov/pubmed/30098967 PubMed]] | |||
Latest revision as of 10:31, 17 May 2022
Presented by
Bsodjahi
Introduction
In order to propose the best decision tool for Amyotrophic Lateral Sclerosis (ALS) prediction, Hasan Aykut et al. presents in this paper a comparative empirical study of the predictive performance of 8 supervised Machine Learning classifiers, namely, Bayesian Networks, Artificial Neural Networks, Logistic Regression, Naïve Bayes, J48, Support Vector Machines, KStar, and K-Nearest Neighbor. With a dataset consisting of blood plasma protein level and independent personal features, for each classifier they predicted ALS patients and found that Bayesian Networks offer the best results based on various metrics such as accuracy (88.7%) and 97% for Area Under the Curve (AUC).
Our summary of the paper commences with the review of previous works underpinning its motivation, next we present the dataset and the methodological approach that the authors used, then we analyze the results which is finally followed by the conclusion.
Previous Work and Motivation
ALS is a nervous system disease that progressively affects brain nerve cells and spinal cord, impacting the patient's upper and lower motor autonomy in the loss of muscle control. Its origin is still unknown, though in some instances it is thought to be hereditary. Sadly, at this point of time, it is not curable and the progressive degeneration of the muscles cannot be halted once started [1] and inexorably results in patient's passing away within 2-5 years [2].
The symptoms that ALS patients exhibit are not distinctively unique to ALS, as they are similar to a host of other neurological disorders. Furthermore, because the impact on patient's motor skill is usually not noticeable in early stage [3], diagnosis at that time is a challenge. One of the main diagnosis protocols, known as El Escorial criteria, involves a battery of tests taking 3-6 months. This is a considerable amount of time since a quicker diagnosis would allow earlier medical monitoring, conducive to patient's life conditions improvement with the possibility of an extended survival.
Given the need of a more timely but effective diagnosis, the authors of this paper proposed to bring to contribution the application of Machine Learning to identify among a list of candidates, the approach that yields the most accurate prediction.
Dataset
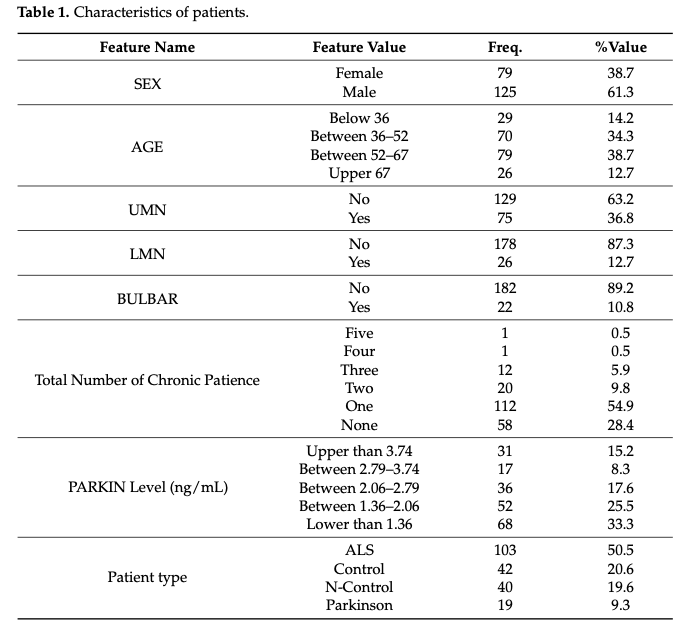
The table below shows an overview of the patient's features for the data which were collected in a prior experimental research. There are overall 204 data points of which about 50% are from ALS patients and the rest consists of Parkinson's patients, Neurological Control group patients, and also healthy participants Control group.

Study Methods
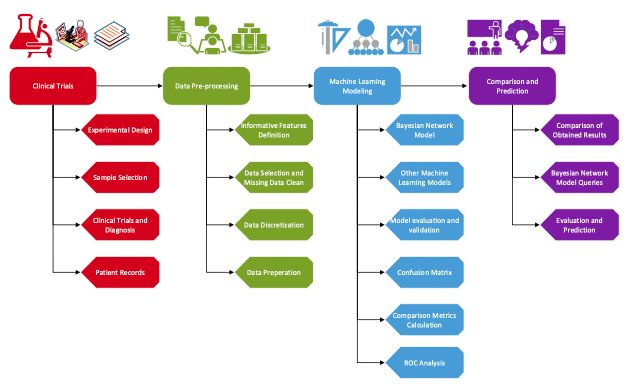
Figure 1 below shows the global architecture of the modelling process in the comparative machine learning performance study. Though all parts are important, the last two are much more of interest to us here and we focus on those.

We provide here an overview of Bayesian Networks, since in the setting of our course it was not covered. Bayesian Networks are graph based statistical models that represent probabilistic relationships among variables and are mathematically formulated as:

They are also referred to as Directed Acyclic Graphs (DAG), i.e., graphs composed of nodes representing variables and arrows representing the direction of the dependency. BN are easily interpretable, especially for non-technical audience and are well adopted in the areas of biology and Medicine [4-5].
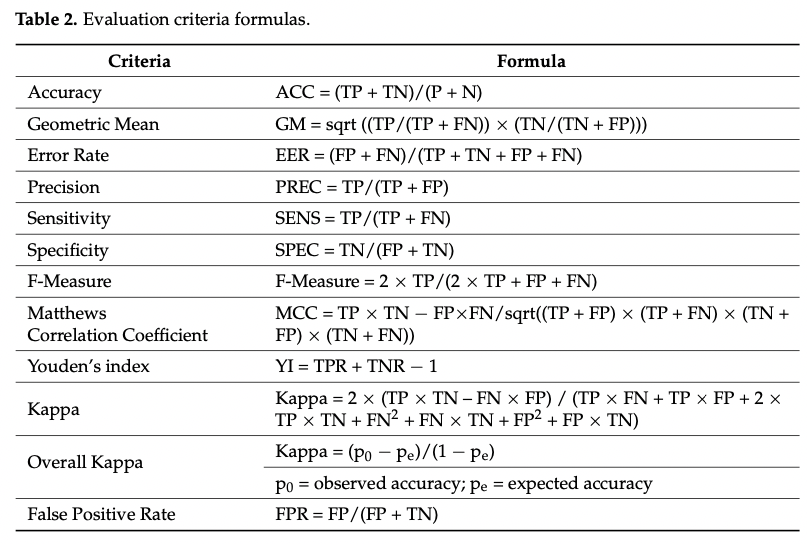
Generally, the choice of an algorithm is informed by the nature of the dataset which also suggests the most appropriate performance evaluation criteria of the technique. For instance, the dataset in this study is characterized on one hand by 4 classes (vs. the typical 2-class) and on the other by the unbalance in the number of participants in each group. Because of this latter characteristic, Hasan Aykut et al. included in their evaluation criteria the Geometric Mean and the Youden' index, since these 2 are known to resist the impact of unbalanced data on the performance evaluation. Table 2 below shows the evaluation criteria formulae.

Results Presentation
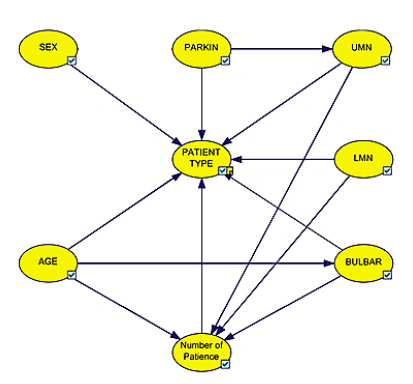
The resulting Bayesian Network from the study is presented below and visually it shows the dependency of the class prediction, i.e., Patient Type, on all the features, some of which have dependency among themselves as well. For example, we can see that the number of patience is dependent on age.

Table 3 summarizes the performance comparison of all 8 techniques through the lens of the 11 evaluation criteria and Bayesian Network comes top in all criteria, including 88.2% on Geometric Mean, 88.3% on Youden's index, 88.7% on accuracy and 97% with the weighted ROC.

Conclusion and Critiques
In this study, Hasan Aykut et al. conducted a technical study to evaluate and determine among 8 algorithms which is the best decision tool for ALS prediction. Eleven evaluation criteria were used and Bayesian Network produced the best results with among other measures, 88.7% on Accuracy and 97% on ROC that is more adequate for unbalanced datasets. In addition to achieving the best predictive performance in this study, Bayesian Networks are also easily interpretable by non-technical audience, justifying its adoption in domains such as biology and medicine.
From our perspective, given the nature of the dataset, which not only is unbalanced but also has 4 different classes, we would suggest Convolutional Neural Network as another method to explore further accuracy improvement though interpretability in that case would be more of a challenge. Because to date its origin is still unknown and very difficult to diagnose in early stage, it is a very important area of research that should rally more members of the Machine Learning and Artificial Intelligence community into further collaboration with the medical community in order to develop a more effective and rapid diagnostic decision tool for the detection of this neurological disorder at its inception as this could contribute to determining its origin and therefore allows for the development of preventative and curative measures.
References
[1] Rowland, L.P.; Shneider, N.A. Amyotrophic Lateral Sclerosis. N. Engl. J. Med. 2001, 344, 1688–1700. [CrossRef] [PubMed]
[2] Hardiman, O.; van den Berg, L.H.; Kiernan, M.C. Clinical Diagnosis and Management of Amyotrophic Lateral Sclerosis. Nat. Rev. Neurol. 2011, 7, 639–649. [CrossRef] [PubMed].
[3] Swinnen, B.; Robberecht, W. The Phenotypic Variability of Amyotrophic Lateral Sclerosis. Nat. Rev. Neurol. 2014, 10, 661. [CrossRef] [PubMed]
[4] Bandyopadhyay, S.; Wolfson, J.; Vock, D.M.; Vazquez-Benitez, G.; Adomavicius, G.; Elidrisi, M.; Johnson, P.E.; OConnor, P.J. Data Mining for Censored Time-to-Event Data: A Bayesian Network Model for Predicting Cardiovascular Risk from Electronic Health Record Data. Data Min. Knowl. Discov. 2015, 29, 1033–1069. [CrossRef]
[5] Kanwar, M.K.; Lohmueller, L.C.; Kormos, R.L.; Teuteberg, J.J.; Rogers, J.G.; Lindenfeld, J.; Bailey, S.H.; McIlvennan, C.K.; Benza, R.; Murali, S.; et al. A Bayesian Model to Predict Survival after Left Ventricular Assist Device Implantation. JACC Heart Fail. 2018, 6, 771–779. [CrossRef] [PubMed]