Predicting Hurricane Trajectories Using a Recurrent Neural Network
Presented by
Yishu Duan, Xibei Di, Xin Yan
Introduction
Hurricanes originate in the warm water of the Caribbean Sea and the Atlantic Ocean and generally travel from their origin to the north, northwest, or northeast. Hurricanes are usually accompanied by strong winds, heavy rainfall, and dangerous tides, as one of the most common natural disasters on the planet, hurricanes could threaten the safety of people’s economic property assets and human lives. This makes predicting the hurricane paths by modeling the hurricane behavior extremely essential.
Recurrent Neural Networks (RNNs) are a kind of artificial neural network, where the weights can be modified to make the model learn complex dynamic time-dependent behavior. An RNN can effectively simulate the complex nonlinear temporal relationship of hurricanes, which can improve the future prediction of the accuracy of hurricane path.
Thus, in this paper, fully connected recurrent neural networks using a grid model are built for hurricane track prediction, and the result will be compared with other hurricane predicting techniques.
Related Work
Scientists had been advocating in developing models for predicting and tracking hurricane paths and had been persistently improving the accuracy over the past decades, whereas these currently existing models are quite different from each other in terms of the structure as well as the complexity. The four main types of models currently used by the National Hurricane Center (NHC) of the National Oceanic and Atmospheric Administration (NOAA) include (Footnote 1):
- Dynamical models
- Complex since the highest computing power is desired to deal with equations of physical motions.
- Ex. Geophysical Fluid Dynamics Laboratory (GFDL) Hurricane Prediction System (by Kurihara, Tuleya, and Bender, 1998)
- Statistical models
- Light-weight since only statistical formulas are used.
- Ex. Statistical non-parametric model (by Hall and Jewson, 2007)
- Statistical-dynamical models
- Allows large-scale variables as predictors.
- Ex. Statistical-dynamical model (by Wang et al., 2009)
- Ensemble or consensus models
- Gives a combination of predictions from different models, physical parameters, or initial conditions.
- Ex. Sparse Recurrent Neural Network (by Moradi Kordmahalleh, Gorji Sefidmazgi, and Homai-far, 2016)
However, since there are not enough collected hurricane observations, and the atmospheric systems are nonlinear and complex, the predictive ability of linear models is limited. Thus, a network that is capable of modeling the hurricane's time-dependent behaviors is desired.
Model Architecture
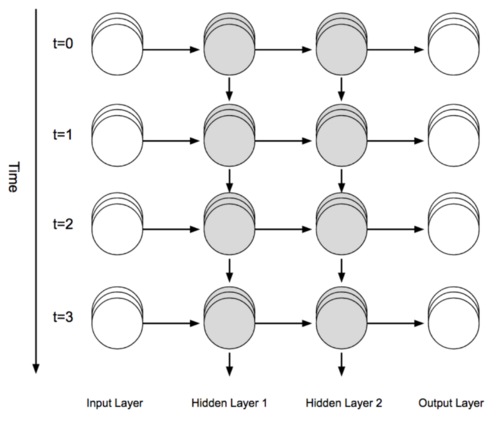
A recurrent neural network, which is capable of modeling nonlinear and complex sequential or dynamical relations between variables, would be used to model the hurricane's time-dependent behaviors. In this fully connected network RNN, the connection weights are the training parameters, which will be updated appropriately. The total time of the network is represented by [math]\displaystyle{ t=1,...,T }[/math] and the number of hidden layers is represented by [math]\displaystyle{ l=1,...,L }[/math] . Figure 1 below shows an example of RNN architecture with two hidden layers.

In this paper, a fully connected RNN employed over a grid system is used for forecasting hurricanes, mainly because the historical information of nonlinear dynamics of the atmospheric system can be accumulated by updating the weight matrix appropriately. By training the RNN to learn the grid system, we would learn the behavior of the hurricane traveling from one grid location to another.
For this RNN grid model, there are several hyperparameters. The grid boundaries are considered hyperparameters since the number of grid blocks in the system can be tuned based on the number of input data. Another hyperparameter is the dropout value, which gives the percentage of input data that should be ignored, in order to prevent the model from overfitting. Another hyperparameter here is the Long Short-Term Memory Cell (LSTM), which is the most successful building unit of RNNs in storing and retrieving information over arbitrary time intervals throughout the RNN. Each LSTM contains three interacting activation layers, and each layer has its own training parameters. The last hyperparameter is the number of hidden layers, also called hidden state vectors, which directly affects the model complexity.
For the model architecture in this paper, there are five layers in total, including an input layer, three hidden layers, and one output layer. The input layer is given a data sequence containing various features of hurricanes, such as the speed of wind, latitude and longitude coordinates of hurricane location, direction of movement, and the grid identification number. The three hidden layers in the middle each have a long short-term memory cell to appropriately encapsulate the complexity of hurricanes behavior. The output layer contains an LSTM, the dropout rate, a dense layer, as well as the final activation layer. This activation function is utilized using hyperbolic tangent, and it outputs values in the range [math]\displaystyle{ [-1,1] }[/math] to better model the direction of the hurricane movements.
Forecasting Result
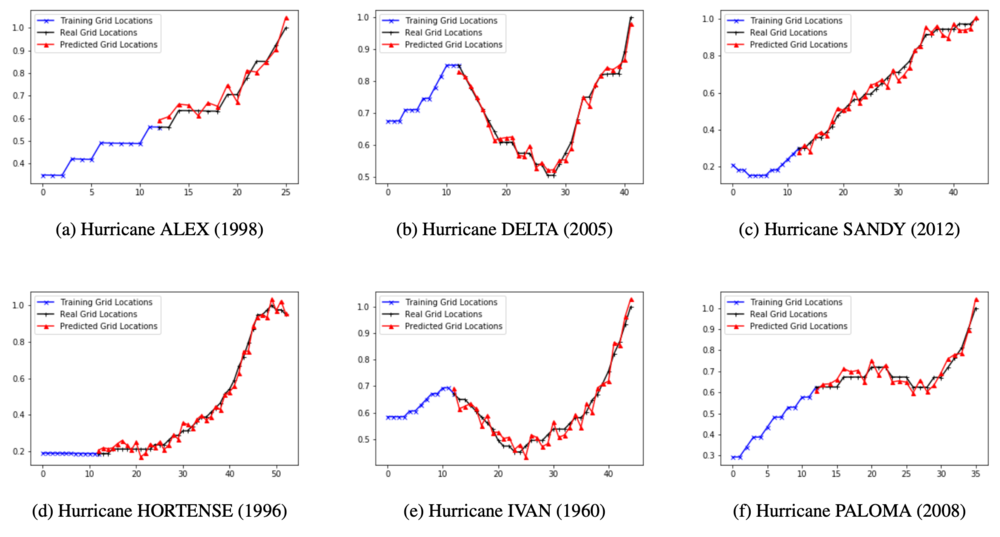
In this experiment, 32327 data provided by Unisys Weather data are used. The dataset is split into training sets and testing sets: 85% of the total hurricanes are used for training, and 15% are used for testing the accuracy of the model’s predictive performance. Each data involves five features: pressure, grid identification number, distance, direction, and wind speed. Figure 2 shows the predictive performance of the built grid-based RNN model on six randomly selected Atlantic Hurricane Trajectories. It can be seen that the grid-based RNN model predicts the hurricane trajectory location well since the real grid locations (black line in the figure) and the predicted grid locations (red line in the figure) match moderately well in all six randomly selected Atlantic Hurricane Trajectory.

Comparison of the grid-based RNN model and the sparse RNN approach
In order to measure the predictive performance of the grid-based model more accurately, the Mean Absolute Error (MAE) result under the grid-based model is calculated, and the MAE is compared with the result obtained by using sparse Recurrent Neural Network, which is mentioned in the Related Work section. Since the algorithm of sparse Recurrent Neural Network is not open source and the results are difficult to reproduce, the MAE of the gird model will be compared with (Moradi Kormahalleh, Gorji Sefidmazgi, and Homaifar 2016) since they used the same dataset and tested with similar hurricanes. Note that their prediction is in the form of latitude and longitude, while the grid-based RNN model built in this paper is predicted in the form of a grid, the average MAE of the latitude and longitude under their prediction will be taken. The result is shown in Table 1. It can be seen that the MAE using the grid-based model is much less than the MAE of using the spare RNN approach in all three hurricanes: DEAN, SANDY, and ISAAC. This is because the grid-based model is capable of predicting hurricane trajectories that are monotonic. Meanwhile, note that due to the use of dynamic time warping (DTW), the hurricanes that contain loops cannot be predicted using the sparse Recurrent Neural Network.

Based on the result shown in Table 1, it can be concluded that the predictive performance of the grid-based RNN model is better than the spare RNN approach.
Comparison of the grid-based RNN model and the National Hurricane Center (NHC) approach
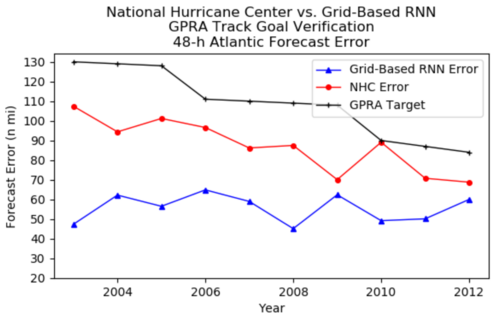
The predictive performance of the grid-based model is compared with the approach used by NHC. The annual errors collected from all tropical cyclones are plotted against the Government Performance and Results (GPRA). These annual errors are calculated for all 48-hour forecasting techniques, as within 48-hour, disaster management and citizen preparedness can be done, having predictions for longer or shorter periods would not be useful. Figure 3 below shows the result. It can be seen that the grid-based RNN Error (blue line) is lower than the NHC Error (red line) from the year 2000 to 2021, which indicates that the predictive performance of grid-based RNN is better than the approach used by the NHC. Thus, it can be concluded that the grid-based RNN introduced in this paper is suitable for hurricane prediction.

Conclusion
The purpose of fitting this recurrent neural network over a grid system is to encapsulate the nonlinearity and complexity of hurricane trajectories prediction and improve the accuracy of forecasting. For both training and testing data, our mean-squared error and root-mean-squared error were 0.01 and 0.11. Compared to “sparse RNN”, the biggest advantage of our RNN grid model is that we can train and predict any type of hurricanes, including loop hurricanes and monotonic hurricanes. Furthermore, by comparing to NHC methods which are currently used, our new method is also more accurate since a refined grid reduces truncation errors. Meanwhile, the RNN learns the behavior of a specific hurricane from a physical location to the next in time, instead of any hurricane in general as hurricanes trajectories can be quite different depending on different nonlinear and dynamic features. In addition, as the data size increases, the current model is so complex that making predictions becomes impractical since each prediction takes too long to be made. In general, this paper is intended to introduce deep learning for making predictions of hurricane trajectories while being more lightweight and with improved accuracy in the model.
Critiques
Even though the final results of grid location predictions are quite accurate, there always exists an error between the predicted and real locations of the hurricanes, since the size of each grid block is not 1x1-degree scale to the real latitude and longitude. Then errors up to 50km could occur when translating the location information from grid location to be described in latitude and longitude. However, since the size of the grid depends on the number of data points per unit area, a bigger dataset could reduce the error efficiently. In the future, artificial neural networks can be used to reduce the error caused by transformation. Also, combining the grid-based RNN method with Bayesian models will increase accuracy, because Bayesian models can quantify the uncertainty of the prediction.
Reference
[1] [2] [3] ...
Footnote 1: NHC Track and Intensity models provided at https://www.nhc.noaa.gov/modelsummary.shtml