BERTScore: Evaluating Text Generation with BERT
Presented by
Gursimran Singh
Introduction
In recent times, various machine learning approaches for text generation have gained popularity. The idea behind this paper is to develop an automatic metric that will judge the quality of the generated text. Commonly used state of the art metrics either uses n-gram approach or word embeddings for calculating the similarity between the reference and the candidate sentence. BertScore, on the other hand, calculates the similarity using contextual embeddings. The authors of the paper have carried out various experiments in Machine Translation and Image Captioning to show why BertScore is more reliable and robust than the previous approaches.
Word versus Context Embeddings
Both models aim to reduce the sparseness invoked by a bag of words (BoW) representation of text due in part to the high dimensional vocabularies. Both methods create embeddings of a dimensionality much lower than sparse BoW and aim to capture semantics and context. Word embeddings differ in that they will be deterministic as when given a word a word embedding model will always produce the same embedding, regardless of the surrounding words. However, contextual embeddings will create different embeddings for a word depending on the surrounding words in the given text.
Previous Work
Previous Approaches for evaluating text generation can be broadly divided into various categories. The commonly used techniques for text evaluation are based on n-gram matching. The main objective here is to compare the n-grams in reference and candidate sentences and thus analyze the ordering of words in the sentences.
The most popular n-Gram Matching metric is BLEU. It follows the underlying principle of n-Gram matching and its uniqueness comes from three main factors.
• Each n-Gram is matched at most once.
• The total of exact-matches is accumulated for all reference candidate pairs and divided by the total number of [math]\displaystyle{ n }[/math]-grams in all candidate sentences.
• Very short candidates are restricted.
Further BLEU is generally calculated for multiple [math]\displaystyle{ n }[/math]-grams and averaged geometrically. n-Gram approaches also include METEOR, NIST, ΔBLEU, etc.
Most of these methods utilize or slightly modify the exact match precision (Exact-[math]\displaystyle{ P_n }[/math]) and recall (Exact-[math]\displaystyle{ R_n }[/math]) scores. This scores can are formalized as follows:
Exact- [math]\displaystyle{ P_n = \frac{\sum_{w \ in S^{n}_{ \hat{x} }} \mathbb{I}[w \in S^{n}_{x}]}{S^{n}_{\hat{x}}} }[/math]
Exact- [math]\displaystyle{ R_n = \frac{\sum_{w \ in S^{n}_{x}} \mathbb{I}[w \in S^{n}_{\hat{x}}]}{S^{n}_{x}} }[/math]
Other categories include Edit-distance-based Metrics, Embedding-based metrics, and Learned Metrics. Most of these techniques do not capture the context of a word in the sentence. Moreover, Learned Metric approaches also require costly human judgments as supervision for each dataset.
Motivation
The n-gram approaches like BLEU do not capture the positioning and the context of the word and simply rely on exact matching for evaluation. Consider the following example that shows how BLEU can result in incorrect judgment.
Reference: people like foreign cars
Candidate 1: people like visiting places abroad
Candidate 2: consumers prefer imported cars
BLEU gives a higher score to Candidate 1 as compared to Candidate 2. This undermines the performance of text generation models since contextually correct sentences are penalized whereas some semantically different phrases are scored higher just because they are closer to the surface form of the reference sentence.
On the other hand, BERTScore computes similarity using contextual token embeddings. It helps in detecting semantically correct paraphrased sentences. It also captures the cause and effect relationship (A gives B in place of B gives A) that isn't detected by the BLEU score.
BERTScore Architecture
Fig 1 summarizes the steps for calculating the BERTScore. Next, we will see details about each step. Here, the reference sentence is given by [math]\displaystyle{ x = ⟨x1, . . . , xk⟩ }[/math] and candidate sentence [math]\displaystyle{ \hat{x} = ⟨\hat{x1}, . . . , \hat{xl}⟩. }[/math]
Token Representation
Reference and the candidate sentences are represented using contextual embeddings. This is inspired by word embedding techniques but in contrast to word embeddings, the contextual embedding of a word depends upon the surrounding words in the sentence. These contextual embeddings are calculated using BERT and other similar models which utilizes self-attention and nonlinear transformations.
Cosine Similarity
Pairwise cosine similarity is calculated between each token [math]\displaystyle{ x_{i} }[/math] in reference sentence and [math]\displaystyle{ \hat{x}_{j} }[/math] in candidate sentence. Prenormalized vectors are used therefore the pairwise similarity is given by [math]\displaystyle{ x_{i}^T \hat{x_{i}}. }[/math]
BERTScore
Each token in x is matched to the most similar token in [math]\displaystyle{ \hat{x} }[/math] and vice-versa for calculating Recall and Precision respectively. The matching is greedy and isolated. Precision and Recall are combined for calculating the F1 score. The equations for calculating Precision, Recall, and F1 Score are as follows
Importance Weighting (optional)
In some cases, rare words can be highly indicative of sentence similarity. Therefore, Inverse Document Frequency (idf) can be used with the above equations of the BERTScore. This is optional and depending on the domain of the text and the available data it may or may not benefit the final results. Thus understanding more about Importance Weighing is an open area of research.
Baseline Rescaling
Rescaling is done only to increase the human readability of the score. In theory, cosine similarity values are between -1 and 1 but practically they are confined in a much smaller range. A value b computed using Common Crawl monolingual datasets is used to linearly rescale the BERTScore. The rescaled recall [math]\displaystyle{ \hat{R}_{BERT} }[/math] is given by
Similarly, [math]\displaystyle{ P_{BERT} }[/math] and [math]\displaystyle{ F_{BERT} }[/math] are rescaled as well.
Experiment & Results
The authors have experimented with different pre-trained contextual embedding models like BERT, RoBERTa, etc, and reported the results for the best performing model. The evaluation has been done on Machine Translation and Image Captioning tasks.
Machine Translation
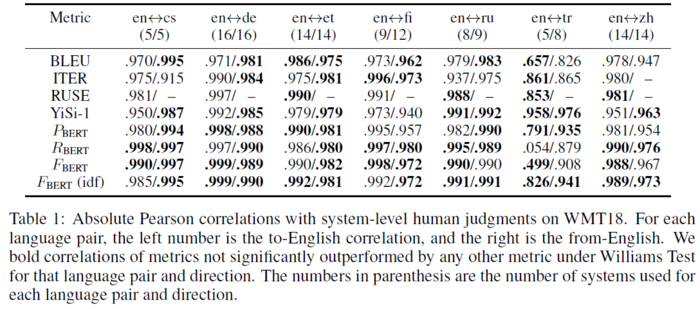
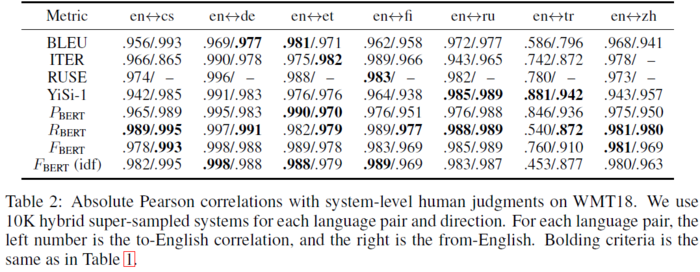
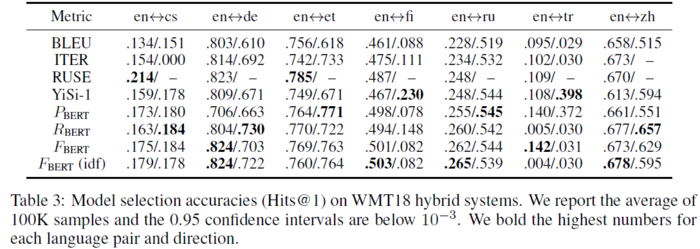
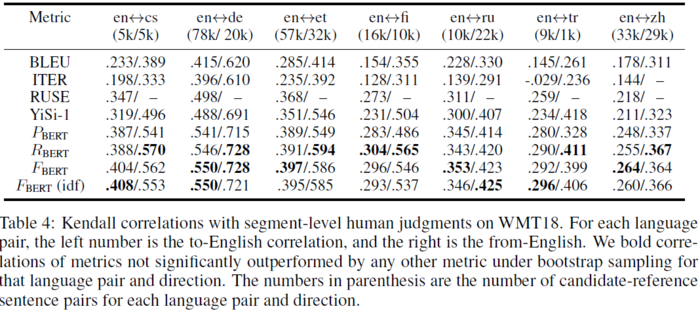
The metric evaluation dataset consists of 149 translation systems, gold references, and two types of human judgments, namely, Segment-level human judgments and System-level human judgments. The former assigns a score to each reference candidate pair and the latter associates a single score for the whole system. Segment-level outputs for BERTScore are calculated as explained in the previous section on architecture and the System-level outputs are calculated by taking an average of BERTScore for every reference-candidate pair. Absolute Pearson Correlation [math]\displaystyle{ \lvert \rho \rvert }[/math] and Kendall rank correlation [math]\displaystyle{ \tau }[/math] are used for calculating metric quality, Williams test [1] for significance of [math]\displaystyle{ \lvert \rho \rvert }[/math] and Graham & Baldwin [2] methods for calculating the bootstrap resampling of [math]\displaystyle{ \tau }[/math]. The authors have also created hybrid systems by randomly sampling one candidate sentence for each reference sentence from one of the systems. This increases the volume of systems for System-level experiments. Further, the authors have also randomly selected 100 systems out of 10k hybrid systems for ranking them using automatic metrics. They have repeated this process multiple times and generated Hits@1, which contains the percentage of the metric ranking agreeing with human ranking on the best system.
In all 4 tables, we can see that BERTScore is consistently a top performer. It also gives a large improvement over the current state-of-the-art BLEU score. In to-English translation, RUSE shows competitive results but it is a learned metric technique and requires costly human judgments as supervision.
Image Captioning
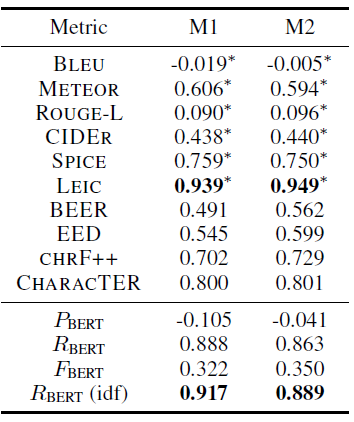
For Image Captioning, human judgment for 12 submission entries from the COCO 2015 Captioning Challenge is used. As per Cui et al. (2018) [3] , Pearson Correlation with two System-Level metrics is calculated. The metrics are the percentage of captions better or equal to human captions (M1) and the percentage of captions that are indistinguishable from human captions (M2). There are approximately 5 reference captions and the BERTScore is taken to be the maximum of all the BERTScores individually with each reference caption. BERTScore is compared with 8 task-agnostic metrics and 2 task-specific metrics.
BERTScore is again a top performer and n-gram metrics like BLEU show a weak correlation with human judgments. For this task, importance weighting shows significant improvement depicting the importance of content words.
Speed: The time taken for calculating BERTScore is not significantly higher than BLEU. For example, with the same hardware, the Machine Translation test on BERTScore takes 15.6 secs compared to 5.4 secs for BLEU. The time range is essentially small and thus the difference is marginal.
Critique & Future Prospects
A text evaluation metric BERTScore is proposed which outperforms the previous approaches because of its capacity to use contextual embeddings for evaluation. It is simple and easy to use. BERTScore is also more robust than previous approaches. This is shown by the experiments carried on the datasets consisting of paraphrased sentences. There are various variants of BERTScore depending upon the contextual embedding model, use of importance weighting, and the evaluation metric (Precision, Recall, or F1 score).
The main reason behind the success of BERTScore is the use of contextual embeddings. The remaining architecture is very simple in itself. There are some word embedding models that use complex metrics for calculating similarity, If we try to use those models along with contextual embeddings instead of word embeddings, they might results in more reliable performance than the BERTScore.
References
[1] Evan James Williams. Regression analysis. wiley, 1959.
[2] Yvette Graham and Timothy Baldwin. Testing for significance of increased correlation with human judgment. In EMNLP, 2014.
[3] Yin Cui, Guandao Yang, Andreas Veit, Xun Huang, and Serge J. Belongie. Learning to evaluate image captioning. In CVPR, 2018.
[4] Kishore Papineni, Salim Roukos, Todd Ward, and Wei-Jing Zhu. Bleu: a method for automatic evaluation of machine translation. In ACL, 2002.
[5] Qingsong Ma, Ondrej Bojar, and Yvette Graham. Results of the WMT18 metrics shared task: Both characters and embeddings achieve good performance. In WMT, 2018.
[6] Jacob Devlin, Ming-Wei Chang, Kenton Lee, and Kristina Toutanova. BERT: Pre-training of deep bidirectional transformers for language understanding. In NAACL-HLT, 2019.
[7] Yinhan Liu, Myle Ott, Naman Goyal, Jingfei Du, Mandar Joshi, Danqi Chen, Omer Levy, Mike Lewis, Luke Zettlemoyer, and Veselin Stoyanov. Roberta: A robustly optimized BERT pretraining approach. arXiv, abs/1907.11692, 2019b.


