Learning to Navigate in Cities Without a Map
Paper: Learning to Navigate in Cities Without a Map[1]
A video of the paper is available here[2].
Introduction
Navigation is an attractive topic in many research disciplines and technology related domains such as neuroscience and robotics. The majority of algorithms are based on the following steps.
1. Building an explicit map
2. Planning and acting using that map.
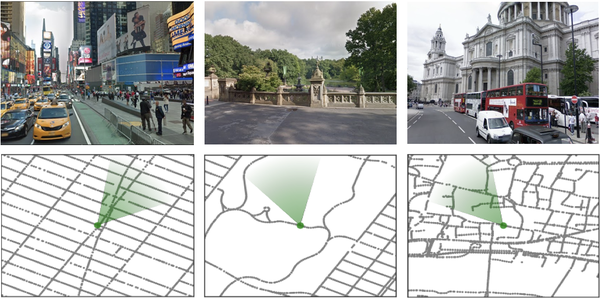
In this article, based on this fact that human can learn to navigate through cities without using any special tool such as maps or GPS, authors propose new methods to show that a neural network agent can do the same thing by using visual observations. To do so, an interactive environment using Google StreetView Images and a dual pathway agent architecture is designed. As shown in figure 1, some parts of the environment are built using Google StreetView images of New York City (Times Square, Central Park) and London (St. Paul’s Cathedral). The green cone represents the agent’s location and orientation. Although learning to navigate using visual aids is shown to be successful in some domains such as games and simulated environments using deep reinforcement learning (RL), it suffers from data inefficiency and sensitivity to changes in the environment. Thus, it is unclear whether this method could be used for large-scale navigation. That’s why it became the subject of investigation in this paper.
Contribution
This paper has made the following contributions:
1. Designing a dual pathway agent architecture. This agent can navigate through a real city. The agent is trained with end-to-end reinforcement learning.
2. Using Goal-dependent learning. This means that the policy and value functions must adapt themselves to a sequence of goals that are provided as input.
3. Leveraging a recurrent neural architecture. Using that, not only could navigation through a city be possible, but also the model is scalable for navigation in new cities.
4. Using a new environment which is built on top of Google StreetView images. This provides real-world images for agent’s observation. Using this environment, the agent can navigate from an arbitrary starting point to a goal and then to another goal etc. Also, London, Paris, and New York City are chosen for navigation.
Related Work
1. Localization from real-world imagery. For example, (Weyand et al., 2016), a CNN was able to achieve excellent results on geolocation task. This paper provides novel work by not including supervised training with ground-truth labels, and by including planning as a goal.
2. Deep RL methods for navigation. For instance, (Mirowski et al., 2016; Jaderberg et al., 2016) used self-supervised auxiliary tasks to produce visual navigation in several created mazes. This paper makes use of real-world data, in contrast to many related papers in this area.
3. Deep RL for path planning and mapping. For example, (Zhang et al., 2017) created an agent that represented a global map.
Environment
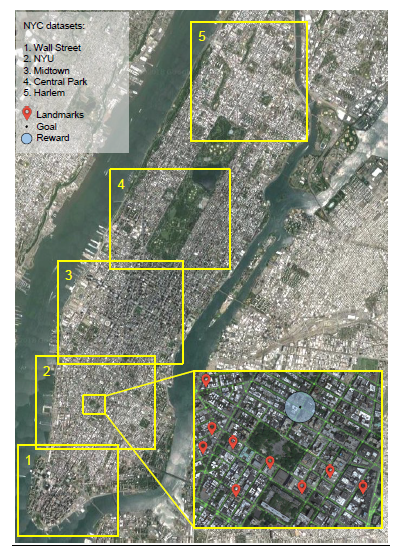
Google StreetView consists of both high-resolution 360-degree imagery and graph connectivity. Also, it provides a public API. These features make it a valuable resource. In this work, large areas of New York, Paris, and London that contain between 7,000 and 65,500 nodes (and between 7,200 and 128,600 edges, respectively), have a mean node spacing of 10m and cover a range of up to 5km chosen (Figure 2), without simplifying the underlying connections. This means that there are many areas 'congested' with nodes, occlusions, available footpaths, etc. The agent only sees RGB images that are visible in StreetView images (Figure 1) and is not aware of the underlying graph.
Agent Interface and the Courier Task
In RL environment, we need to define observations and actions in addition to tasks. The inputs to the agent are the image [math]\displaystyle{ x_t }[/math] and the goal [math]\displaystyle{ g_t }[/math]. Also, a first-person view of the 3D environment is simulated by cropping [math]\displaystyle{ x_t }[/math] to a 60-degree square RGB image that is scaled to 84*84 pixels. Furthermore, the action space consists of 5 movements: “slow” rotate left or right (±22:5), “fast” rotate left or right (±67.5), or move forward.
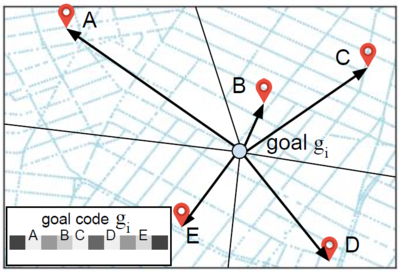
There are lots of ways to specify the goal to the agent. In this paper, the current goal is chosen to be represented in terms of its proximity to a set L of fixed landmarks [math]\displaystyle{ L={(Lat_k, Long_k)} }[/math] which is specified using Latitude and Longitude coordinate system. For distance to the [math]\displaystyle{ k_{th} }[/math] landmark [math]\displaystyle{ {(d_{(t,k)}^g})_k }[/math] the goal vector contains [math]\displaystyle{ g_{(t,i)}=\tfrac{exp(-αd_{(t,i)}^g)}{∑_k exp(-αd_{(t,k)}^g)} }[/math]for [math]\displaystyle{ i_{th} }[/math] landmark with [math]\displaystyle{ α=0.002 }[/math] (Figure 3).
This form of representation has 2 advantages:
1. It could easily be extended to new environments.
2. It is intuitive. Even humans and animals use landmarks to be able to move from one place to another.
In this work 644 landmarks for New York, Paris, and London is manually defined. Furthermore, in each episode, which consists of 1000 steps, the agent starts from a random place with random orientation. when an agent gets within 100 meters of goal, the next goal is randomly chosen. Finally, the goal is proportional to the shortest path between agent and goal.
Methods
Goal-dependent Actor-Critic Reinforcement Learning
In this paper, the learning problem is based on Markov Decision Process, with state space S, action space A, environment Ɛ, and a set of possible goals G. The reward function depends on the current goal and state: [math]\displaystyle{ R: S×G×A → R }[/math]. maximize the expected sum of discounted rewards starting from state [math]\displaystyle{ s_0 }[/math] with discount Ƴ. Also the expected return from [math]\displaystyle{ s_t }[/math] depends on the goals that are sampled. So, policy and value functions are as follows.
\begin{align} g_t:π(α|s,g)=Pr(α_t=α|s_t=s, g_t=g) \end{align}
\begin{align} V^π(s,g)=E[R_t]=E[Σ_{k=0}^∞Ƴ^kr_{t+k}|s_t=s, g_t=g] \end{align}
Also, an architecture with multiple pathways is designed to support two types of learning that is required for this problem. First, an agent needs an internal representation which is general and gives an understanding of a scene. Second, the agent needs to remember features that are available in a specific place.
Architectures
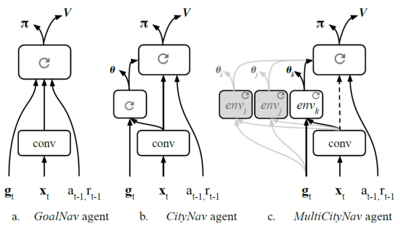
The agent takes image pixels as input. Then, These pixels are passed through a convolutional network. The output of the Convolution network is fed to a Long Short-Term Memory (LSTM) as well as the past reward [math]\displaystyle{ r_{t-1} }[/math] and previous action [math]\displaystyle{ α_{t-1} }[/math].
Three different architectures are described below.
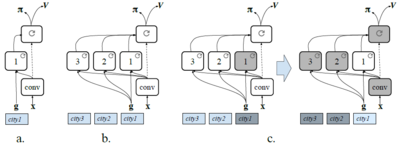
The GoalNav architecture (Fig. 4a) which consists of a convolutional architecture and policy LSTM. Goal description [math]\displaystyle{ g_t }[/math], previous action, and reward are the inputs of this LSTM.
The CityNav architecture (Fig. 4b) consists of the previous architecture alongside an additional LSTM, called the goal LSTM. Inputs of this LSTM are visual features and the goal description. The CityNav agent also adds an auxiliary heading (θ) prediction task which is defined as an angle between the north direction and the agent’s pose. This auxiliary task can speed up learning and provides relevant information.
The MultiCityNav architecture (Fig. 4c) is an extension of City-Nav for learning in different cities. This is done using the parallel connection of goal LSTMs for encapsulating locale-specific features, for each city. Moreover, the convolutional architecture and the policy LSTM become general after training on a number of cities. So, new goal LSTMs are required to be trained in new cities.
Curriculum Learning
In curriculum learning, the model is trained using simple examples in first steps. As soon as the model learns those examples, more complex and difficult examples would be fed to the model. In this paper, this approach is used to teach agent to navigate to further destinations. This courier task suffers from a common problem of RL tasks which is sparse rewarding very sparse rewards. To overcome this problem, a natural curriculum scheme is defined, in which sampling each new goal would be within 500m of the agent’s position. Then, the maximum range increases gradually to cover the full range(3.5km in the smaller New York areas, or 5km for central London or Downtown Manhattan)
Results
In this section, the performance of the proposed architectures on the courier task is shown.
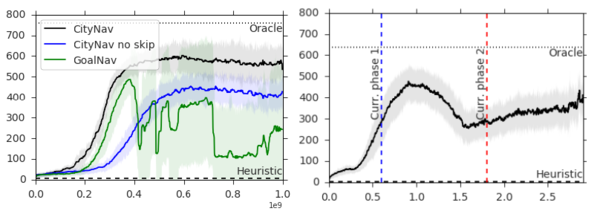
It is first shown that the CityNav agent, trained with curriculum learning, succeeds in learning the courier task in New York, London and Paris. Figure 5 compares the following agents.
1. Goal Navigation agent.
2. City Navigation Agent.
3. A City Navigation agent without the skip connection from the vision layers to the policy LSTM. This is needed to regularise the interface between the goal LSTM and the policy LSTM in multi-city transfer scenario.
Also, a lower bound(Heuristic) and an upper bound(Oracle) on the performance is considered. As it is said in the paper: "Heuristic is a random walk on the street graph, where the agent turns in a random direction if it cannot move forward; if at an intersection it will turn with a probability [math]\displaystyle{ P=0.95 }[/math]. Oracle uses the full graph to compute the optimal path using breadth-first search.". As it is clear in Figure 5, CityNav architecture with the previously mentioned architecture attains a higher performance and is more stable than the simpler GoalNav agent.
The trajectories of the trained agent over two 1000 step episodes and the value function of the agent during navigation to a destination is shown in Figure 6.
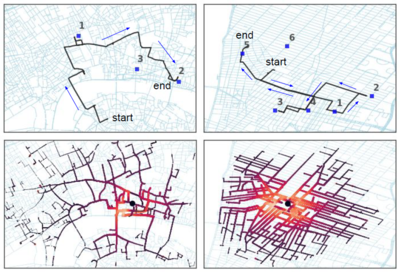
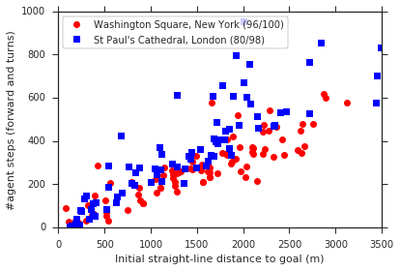
Figure 7 shows that navigation policy is learned by agent successfully in St Paul’s Cathedral in London and Washington Square in New York.
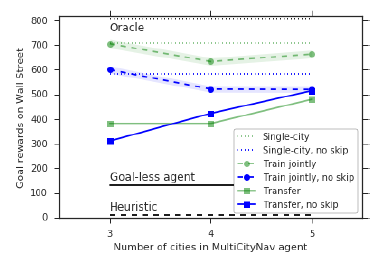
A critical test for this article is to transfer model to new cities by learning a new set of landmarks, but without re-learning visual representation, behaviors, etc. Therefore, the MultiCityNav agent is trained on a number of cities besides freezing both the policy LSTM and the convolutional encoder. Then a new locale-specific goal LSTM is trained. The performance is compared using three different training regimes, illustrated in Fig. 9: Training on only the target city (single training); training on multiple cities, including the target city, together (joint training); and joint training on all but the target city, followed by training on the target city with the rest of the architecture frozen (pre-train and transfer). Figure 10 shows that transferring to other cities is possible. Also, training the model on more cities would increase its effectiveness. According to the paper: "Remarkably, the agent that is pre-trained on 4 regions and then transferred to Wall Street achieves comparable performance to an agent trained jointly on all the regions, and only slightly worse than single-city training on Wall Street alone". Training the model in a single city using skip connection is useful. However, it is not useful in multi-city transferring.
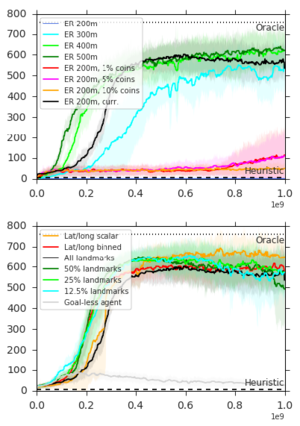
Giving early rewards before agent reaches the goal or adding random rewards (coins) to encourage exploration is investigated in this article. Figure 11a suggests that coins by themselves are ineffective as our task does not benefit from wide explorations. Also, as it is clear from Figure 11b, reducing the density of the landmarks does not seem to reduce the performance. Based on the results, authors chose to start sampling the goal within a radius of 500m from the agent’s location, and then progressively extend it to the maximum distance an agent could travel within the environment. In addition, to asses the importance of the goal-conditioned agents, a Goal-less CityNav agent is trained by removing inputs gt. The poor performance of this agent is clear in Figure 11b. Furthermore, reducing the density of the landmarks by the ratio of 50%, 25%, and 12:5% does not reduce the performance that much. Finally, some alternative for goal representation is investigated:
a) Latitude and longitude scalar coordinates normalized to be between 0 and 1.
b) Binned representation.
The latitude and longitude scalar goal representations perform the best. However, since the all landmarks representation performs well while remaining independent of the coordinate system, we use this representation as the canonical one.
Conclusion
In this paper, a deep reinforcement learning approach that enables navigation in cities is presented. Furthermore, a new courier task and a multi-city neural network agent architecture that is able to be transferred to new cities is discussed.
Critique
1. It is not clear that how this model is applicable in the real world. A real-world navigation problem needs to detect objects, people, and cars. However, it is not clear whether they are modeling them or not. From what I understood, they did not care about the collision, which is against their claim that it is a real-world problem.
2. This paper is only using static google street view images as its primary source of data. But the authors must at least complement this with other dynamic data like traffic and road blockage information for a realistic model of navigation in the world.
3. The 'Transfer in Multi-City Experiments' results could strengthened significantly from cross-validation (only Wall Street, which covers the smallest area of the four regions, is used as the test case). Additionally, the results do not show true 'multi-city' transfer learning, since all regions are within New York City. It is stated in the paper that not having to re-learn visual representations when transferring between cities is one of the outcomes, but the tests do not actually check for this. There are likely significant differences in the features that would be learned in NYC vs. Waterloo, for example, and this type of transfer has not been evaluated.