Uncategorized files
Jump to navigation
Jump to search
Showing below up to 50 results in range #1,051 to #1,100.
-
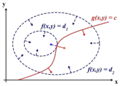 LagrangeMultipliers2D.svg.png 300 × 216; 15 KB
-
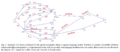
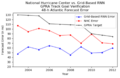
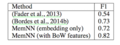 Largescale.png 340 × 127; 45 KB
-
 Lattice.PNG 1,115 × 486; 105 KB
-
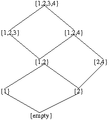 Lattice.png 225 × 246; 4 KB
-
 Layer 1.png 798 × 161; 22 KB
-
 Layer 2.png 1,125 × 228; 40 KB
-
 Lda-qda-parameters.png 666 × 521; 5 KB
-
 Lda.jpg 417 × 318; 26 KB
-
 Lds.jpg 417 × 318; 26 KB
-
 Learning Spectral clustering experiment 1.png 1,400 × 1,126; 114 KB
-
 Learning Spectral clustering experiment 2.png 1,400 × 1,253; 253 KB
-
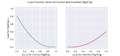
 Learning rate.jpg 765 × 335; 48 KB
-
 Lec3.jpg 560 × 420; 14 KB
-
 Lemonade Example.png 1,090 × 572; 119 KB
-
 Lif neuron.png 402 × 311; 21 KB
-
 LightRNN.PNG 789 × 431; 47 KB
-
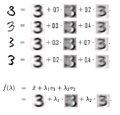
 Lincomb1.jpg 371 × 81; 8 KB
-
 Lincomb2.jpg 369 × 102; 15 KB
-
 LineExample1.PNG 1,629 × 433; 44 KB
-
 LineExample1.png 1,629 × 433; 44 KB
-
 Line graphs.png 1,354 × 880; 234 KB
-
 Linear Congruential Statment.png 595 × 207; 27 KB
-
 Linear comb PCA.png 424 × 407; 62 KB
-
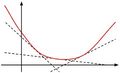
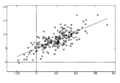 Linear regression.png 447 × 309; 4 KB
-
 Linearregression.png 561 × 420; 9 KB
-
 Linreg1.jpg 560 × 420; 21 KB
-
 Linreg2.jpg 560 × 420; 21 KB
-
 Llda.jpg 231 × 348; 13 KB
-
 Llda.png 231 × 348; 9 KB
-
 Locations.png 340 × 75; 43 KB
-
 Logit0.gif 300 × 200; 3 KB
-
 Logit0.jpg 300 × 200; 9 KB
-
 Logit1.gif 300 × 200; 3 KB
-
 Logit1.jpg 300 × 200; 8 KB
-
 Logreg cost.jpg 560 × 420; 19 KB
-
 Loss 1.PNG 396 × 113; 6 KB
-
 Loss 2.PNG 460 × 108; 6 KB
-
 Loss Function.png 1,493 × 492; 98 KB
-
 Loss distribution.png 603 × 361; 22 KB
-
 Loss function chart.png 1,600 × 746; 99 KB
-
 Lower Bound.jpg 411 × 250; 9 KB
-
 Ltsm settings.png 502 × 184; 23 KB
-
 M2.png 1,035 × 569; 705 KB
-
 MAML.png 597 × 429; 88 KB
-
 MAML2.png 922 × 444; 152 KB
-
 MATLAB Beta.jpg 560 × 420; 24 KB
-
 MATLAB Exp.jpg 1,024 × 673; 27 KB
-
 MATLAB Y.jpg 560 × 420; 18 KB
-
 MCA Example.jpg 561 × 420; 16 KB
-
 MCC.png 207 × 134; 13 KB


