stat946f11
Introduction
Notation
We will begin with short section about the notation used in these notes. \newline Capital letters will be used to denote random variables and lower case letters denote observations for those random variables:
- [math]\displaystyle{ \{X_1,\ X_2,\ \dots,\ X_n\} }[/math] random variables
- [math]\displaystyle{ \{x_1,\ x_2,\ \dots,\ x_n\} }[/math] observations of the random variables
The joint probability mass function can be written as:
or as shorthand, we can write this as [math]\displaystyle{ p( x_1, x_2, \dots, x_n ) }[/math]. In these notes both types of notation will be used. We can also define a set of random variables [math]\displaystyle{ X_Q }[/math] where [math]\displaystyle{ Q }[/math] represents a set of subscripts.
Example
Let [math]\displaystyle{ A = \{1,4\} }[/math], so [math]\displaystyle{ X_A = \{X_1, X_4\} }[/math]; [math]\displaystyle{ A }[/math] is the set of indices for
the r.v. [math]\displaystyle{ X_A }[/math].
Also let [math]\displaystyle{ B = \{2\},\ X_B = \{X_2\} }[/math] so we can write
Graphical Models
Graphs can be represented as a pair of vertices and edges: [math]\displaystyle{ G = (V, E). }[/math]
- [math]\displaystyle{ V }[/math] is the set of nodes (vertices).
- [math]\displaystyle{ E }[/math] is the set of edges.
If the edges have a direction associated with them then we consider the graph to be directed as in Figure 1, otherwise the graph is undirected as in Figure 2.
We will use graphs in this course to represent the relationship between different random variables.
Directed graphical models
In the case of directed graphs, the direction of the arrow indicates "causation". For example:
[math]\displaystyle{ A \longrightarrow B }[/math]: \ [math]\displaystyle{ A }[/math] "causes" [math]\displaystyle{ B }[/math]
In this case we must assume that our directed graphs are acyclic. If our causation graph contains a cycle then it would mean that for example:
- A causes B
- B causes C
- C causes A again.
Clearly, this would confuse the order of the events. An example of a graph with a cycle can be seen in Figure 3. Such a graph could not be used to represent causation. The graph in Figure 4 does not have cycle and we can say that the node [math]\displaystyle{ X_1 }[/math] causes, or affects, [math]\displaystyle{ X_2 }[/math] and [math]\displaystyle{ X_3 }[/math] while they in turn cause [math]\displaystyle{ X_4 }[/math].
We will consider a 1-1 map between our graph's vertices and a set of random variables. Consider the following example that uses boolean random variables. It is important to note that the variables need not be boolean and can indeed be discrete over a range or even continuous.
Example
In this example we will consider the possible causes for wet grass.
The wet grass could be caused by rain, or a sprinkler. Rain can be caused by clouds. On the other hand one can not say that clouds cause the use of a sprinkler. However, the causation exists because the presence of clouds does affect whether or not a sprinkler will be used. If there are more clouds there is a smaller probability that one will rely on a sprinkler to water the grass. As we can see from this example the relationship between two variables can also act like a negative correlation. The corresponding graphical model is shown in Figure 5.
This directed graph shows the relation between the 4 random variables. If we have the joint probability [math]\displaystyle{ P(C,R,S,W) }[/math], then we can answer many queries about this system.
This all seems very simple at first but then we must consider the fact that in the discrete case the joint probability function grows exponentially with the number of variables. If we consider the wet grass example once more we can see that we need to define [math]\displaystyle{ 2^4 = 16 }[/math] different probabilities for this simple example. The table bellow that contains all of the probabilities and their corresponding boolean values for each random variable is called an interaction table.
Example:
Now consider an example where there are not 4 such random variables but 400. The interaction table would become too large to manage. In fact, it would require [math]\displaystyle{ 2^{400} }[/math] rows! The purpose of the graph is to help avoid this intractability by considering only the variables that are directly related. In the wet grass example Sprinkler (S) and Rain (R) are not directly related.
To solve the intractability problem we need to consider the way those relationships are represented in the graph. Let us define the following parameters. For each vertex [math]\displaystyle{ i \in V }[/math],
- [math]\displaystyle{ \pi_i }[/math]: is the set of parents of [math]\displaystyle{ i }[/math]
- ex. [math]\displaystyle{ \pi_R = C }[/math] \ (the parent of [math]\displaystyle{ R = C }[/math])
- [math]\displaystyle{ f_i(x_i, x_{\pi_i}) }[/math]: is the joint p.d.f. of [math]\displaystyle{ i }[/math] and [math]\displaystyle{ \pi_i }[/math] for which it is true that:
- [math]\displaystyle{ f_i }[/math] is nonnegative for all [math]\displaystyle{ i }[/math]
- [math]\displaystyle{ \displaystyle\sum_{x_i} f_i(x_i, x_{\pi_i}) = 1 }[/math]
Claim: There is a family of probability functions [math]\displaystyle{ P(X_V) = \prod_{i=1}^n f_i(x_i, x_{\pi_i}) }[/math] where this function is nonnegative, and
To show the power of this claim we can prove the equation (\ref{eqn:WetGrass}) for our wet grass example:
We want to show that
Consider factors [math]\displaystyle{ f(C) }[/math], [math]\displaystyle{ f(R,C) }[/math], [math]\displaystyle{ f(S,C) }[/math]: they do not depend on [math]\displaystyle{ W }[/math], so we can write this all as
since we had already set [math]\displaystyle{ \displaystyle \sum_{x_i} f_i(x_i, x_{\pi_i}) = 1 }[/math].
Let us consider another example with a different directed graph.
Example:
Consider the simple directed graph in Figure 6.

Assume that we would like to calculate the following: [math]\displaystyle{ p(x_3|x_2) }[/math]. We know that we can write the joint probability as:
We can also make use of Bayes' Rule here:
We also need
Thus,
Theorem 1.
.
In our simple graph, the joint probability can be written as
Instead, had we used the chain rule we would have obtained a far more complex equation:
The Markov Property, or Memoryless Property is when the variable [math]\displaystyle{ X_i }[/math] is only affected by [math]\displaystyle{ X_j }[/math] and so the random variable [math]\displaystyle{ X_i }[/math] given [math]\displaystyle{ X_j }[/math] is independent of every other random variable. In our example the history of [math]\displaystyle{ x_4 }[/math] is completely determined by [math]\displaystyle{ x_3 }[/math].
By simply applying the Markov Property to the chain-rule formula we would also have obtained the same result.
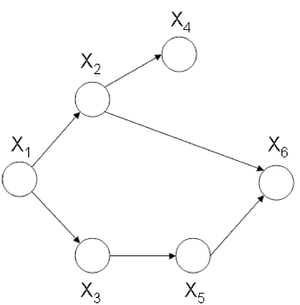
Now let us consider the joint probability of the following six-node example found in Figure 7.

If we use Theorem 1 it can be seen that the joint probability density function for Figure 7 can be written as follows:
Once again, we can apply the Chain Rule and then the Markov Property and arrive at the same result.
Independence
Marginal independence
We can say that [math]\displaystyle{ X_A }[/math] is marginally independent of [math]\displaystyle{ X_B }[/math] if:
Conditional independence
We can say that [math]\displaystyle{ X_A }[/math] is conditionally independent of [math]\displaystyle{ X_B }[/math] given [math]\displaystyle{ X_C }[/math] if:
Aside: Before we move on further, we first define the following terms:
- I is defined as an ordering for the nodes in graph C.
- For each [math]\displaystyle{ i \in V }[/math], [math]\displaystyle{ V_i }[/math] is defined as a set of all nodes that appear earlier than i excluding [math]\displaystyle{ \pi_i }[/math].
Let us consider the example of the six node figure given above (Figure 7). We can define [math]\displaystyle{ I }[/math] as follows:
We can then easily compute [math]\displaystyle{ V_i }[/math] for say [math]\displaystyle{ i=3,6 }[/math].
[math]\displaystyle{ V_3 = \{2\}, V_6 = \{1,3,4\} }[/math]
We would be interested in finding the conditional independence between random variables in this graph. We know [math]\displaystyle{ X_i \perp X_{v_i} | X_{\pi_i} }[/math] for each [math]\displaystyle{ i }[/math]. So:
[math]\displaystyle{ X_1 \perp \phi | \phi }[/math],
[math]\displaystyle{ X_2 \perp \phi | X_1 }[/math],
[math]\displaystyle{ X_3 \perp X_2 | X_1 }[/math],
[math]\displaystyle{ X_4 \perp \{X_1,X_3\} | X_2 }[/math],
[math]\displaystyle{ X_5 \perp \{X_1,X_2,X_4\} | X_3 }[/math],
[math]\displaystyle{ X_6 \perp \{X_1,X_3,X_4\} | \{X_2,X_5\} }[/math]
To illustrate why this is true we can take a simple example. Show that:
Proof: first, we know [math]\displaystyle{ }[/math]P(X_1,X_2,X_3,X_4,X_5,X_6) = P(X_1)P(X_2|X_1)P(X_3|X_1)P(X_4|X_2)P(X_5|X_3)P(X_6|X_5,X_2)[math]\displaystyle{ }[/math]
then
The other conditional independences can be proven through a similar process.
Bayes Ball
The Bayes Ball algorithm can be used to determine if two random variables represented in a graph are independent. The algorithm can show that either two nodes in a graph are independent OR that they are not necessarily independent. The Bayes Ball algorithm can not show that two nodes are dependant. The algorithm will be discussed further in later parts of this section.
Canonical Graphs
In order to understand the Bayes Ball algorithm we need to first introduce 3 canonical graphs.
Markov Chain
In the following graph (Figure 8 X is independent of Z given Y.
We say that: [math]\displaystyle{ X }[/math] [math]\displaystyle{ \perp }[/math] [math]\displaystyle{ Z }[/math] [math]\displaystyle{ | }[/math] [math]\displaystyle{ Y }[/math]

We can prove this independence:
Where
Hidden Cause
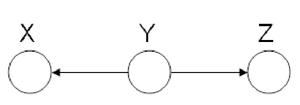
In the Hidden Cause case we can say that X is independent of Z given Y. In this case Y is the hidden cause and if it is known then Z and X are considered independent.
We say that: [math]\displaystyle{ X }[/math] [math]\displaystyle{ \perp }[/math] [math]\displaystyle{ Z }[/math] [math]\displaystyle{ | }[/math] [math]\displaystyle{ Y }[/math]

The proof of the independence:
The Hidden Cause case is best illustrated with an example:
In Figure 10 it can be seen that both "Shoe Size" and "Grey Hair" are dependant on the age of a person. The variables of "Shoe size" and "Grey hair" are dependent in some sense, if there is no "Age" in the picture. Without the age information we must conclude that those with a large shoe size also have a greater chance of having gray hair. However, when "Age" is observed, there is no dependence between "Shoe size" and "Grey hair" because we can deduce both based only on the "Age" variable.
Explaining-Away
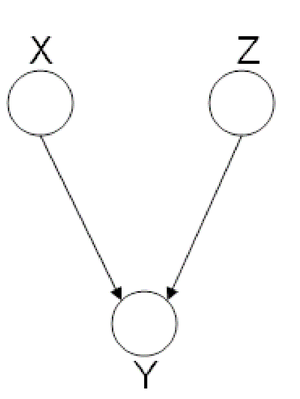
Finally, we look at the third type of canonical graph: Explaining-Away Graphs. This type of graph arises when a phenomena has multiple explanations. Here, the conditional independence statement is actually a statement of marginal independence: [math]\displaystyle{ X \amalg Z }[/math].

In these types of scenarios, variables X and Z are independent. However, once the third variable Y is observed, X and Z become dependent (Fig. 11).
To clarify these concepts, suppose Bob and Mary are supposed to meet for a noontime lunch. Consider the following events:
If Mary is late, then she could have been kidnapped by aliens. Alternatively, Bob may have forgotten to adjust his watch for daylight savings time, making him early. Clearly, both of these events are independent. Now, consider the following probabilities:
We expect [math]\displaystyle{ P( late = 1 ) \lt P( aliens = 1 ~|~ late = 1 ) }[/math] since $P( aliens = 1 ~|~ late = 1 )$ does not provide any information regarding Bob's watch. Similarly, we expect $P( aliens = 1 ~|~ late = 1 ) < P( aliens = 1 ~|~ late = 1, watch = 0 )$. Since [math]\displaystyle{ P( aliens = 1 ~|~ late = 1 ) \neq P( aliens = 1 ~|~ late = 1, watch = 0 ) }[/math], aliens and watch are not independent given late. To summarize,
- If we do not observe late, then aliens [math]\displaystyle{ ~\amalg~ watch }[/math] ([math]\displaystyle{ X~\amalg~ Z }[/math])
- If we do observe late, then aliens [math]\displaystyle{ ~\cancel{\amalg}~ watch ~|~ late }[/math]
([math]\displaystyle{ X ~\cancel{\amalg}~ Z ~|~ Y }[/math])