Convergence of multiplicative Ito scheme
This script is an implementation of a really simple stochastic ODE with multiplicative noise to test the Euler Maruyama scheme.
Contents
clear all, close all
Begin defining various parameters and setting initializations
Initialize the random number generator and seed it.
rng('shuffle');
Specify the global parameters.
mysig=0.3;
myper=3e-2;
Specify the time step and stochastic parameters.
Sets how many time steps between saves.
numsteps=10;
Sets the number of outputs.
numouts=1000;
Sets the time step. Stochastic methods are low order so small time steps tend to be required.
dt=1e-5;
For white noise this is needed.
dtrt=sqrt(dt);
dtb=dt*numsteps;
dtbrt=sqrt(dtb);
Sets the number of ensemble members.
numens=4000;
Set up arrays for storage and store initial state.
noise=randn(numsteps*numouts,numens);
t=0;
xs=zeros(numouts+1,numens);
xs2=zeros(numouts+1,numens);
xbs=zeros(numouts+1,numens);
x0=ones(1,numens);
xs(1,:)=x0;
xbs(1,:)=x0;
xd=x0(1);x=x0;x2=x0;
ts(1)=t;
cntr=0;
xs(1,:)=x;
xds(1)=xd;
ts(1)=t;
Primary Loop
for ii=1:numouts
    oldt=t;
    oldnoise=noise(cntr+1,:);
    for jj=1:numsteps
        cntr=cntr+1;
        xd=xd+dt*sin(2*pi*t/myper);
Notice the extra multiplicative term.
        x=x+dt*sin(2*pi*t/myper)+dtrt*mysig*noise(cntr,:)*sin(2*pi*t/myper);
        t=t+dt;
end
Notice the extra multiplicative term.
    xbs(ii+1,:)=xbs(ii,:)+dtb*sin(2*pi*oldt/myper)+dtbrt*mysig*oldnoise*sin(2*pi*oldt/myper);
    xs(ii+1,:)=x;
    xds(ii+1)=xd;
    ts(ii+1)=t;
end
Plot
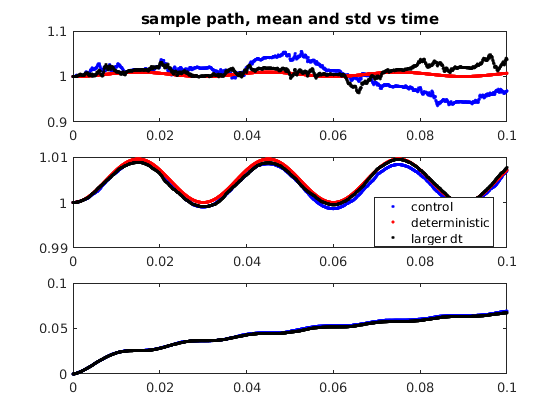
Plot one path, mean and standard deviation.
figure(1)
clf
subplot(3,1,1)
plot(ts,xs(:,1),'b.',ts,xds,'r.',ts,xbs(:,1),'k.')
title('sample path, mean and std vs time')
subplot(3,1,2)
plot(ts,mean(xs,2),'b.',ts,xds,'r.',ts,mean(xbs,2),'k.')
legend('control','deterministic','larger dt','Location','best')
subplot(3,1,3)
plot(ts,std(xs,[],2),'b.',ts,std(xbs,[],2),'k.')
Plot statistics by ensemble size.
figure(2)
clf
subplot(2,1,1)
plot(ts,mean(xs,2),'b.',ts,xds,'r.',ts,mean(xs(:,1:numens/2),2),'k.',ts,mean(xs(:,1:numens/4),2),'g.')
title('convergence by ensemble size')
legend('control','deterministic','half ensemble','quarter ensemble','Location','best')
subplot(2,1,2)
plot(ts,std(xs,[],2),'b.',ts,std(xs(:,1:numens/2),[],2),'k.',ts,std(xs(:,1:numens/4),[],2),'g.')
