Using graphics objects as structures
Ever since Matlab 2014b, figures and other graphics are treated as a special kind of structure. This means that you can use the same structure syntax to interact with the properties of graphical objects.
fig = figure(1)
fig =

  Figure (1) with properties:

      Number: 1
        Name: ''
       Color: [1 1 1]
    Position: [680 558 560 420]
       Units: 'pixels'

  Use GET to show all properties
"fig" is now a 1x1 Figure object with various properties. In the previous system this would just return an integer You can change these properties using the "." notation. For example, to change the units of your figure you can write.
fig.Units = 'normalized';
To see a list of the figure properties please go to https://www.mathworks.com/help/matlab/ref/figure-properties.html.
Before Matlab 2014b in order to change these properties you had to use the "get" and "set" commands. These still work in this new system. Another way of changing the units would be:
set(fig,'Units','normalized')
In order to actually display a plot you need to create a set of axes. If you just use one of the various plotting functions such as "plot" or "contourf" it will create a set of axes in your figure and then display your plot within them. You can also create an empty set of axes using "axes".
ax1 = axes
ax1 =

  Axes with properties:

             XLim: [0 1]
             YLim: [0 1]
           XScale: 'linear'
           YScale: 'linear'
    GridLineStyle: '-'
         Position: [0.1300 0.1100 0.7750 0.8150]
            Units: 'normalized'

  Use GET to show all properties
If you wish to create various axes within the same figure use the "subplot" command. with this command you create a "grid" that is m-by-n with each sub-axes spanning some multiple of the grid. The notation is subplot(m grid,n grid, locations).
subplot(2,1,1)
subplot(2,1,2)
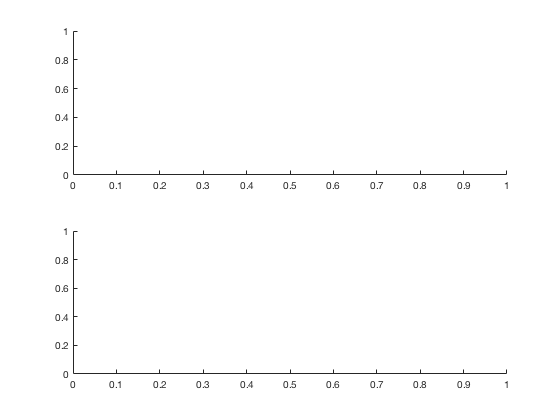
One of the key advantages of this new graphical structure system is that these subplots are now contained within the properties of the parent figure.
sub1 = fig.Children(1)
sub1 =

  Axes with properties:

             XLim: [0 1]
             YLim: [0 1]
           XScale: 'linear'
           YScale: 'linear'
    GridLineStyle: '-'
         Position: [0.1300 0.1100 0.7750 0.3412]
            Units: 'normalized'

  Use GET to show all properties
All your subplots (and other objects such as colourbars) are considered "children" of the parent figure. You can interact with these child axes structures in the same way as the figures.
fig.Children(1).Units = 'normalized'
fig =

  Figure (1) with properties:

      Number: 1
        Name: ''
       Color: [1 1 1]
    Position: [0.3536 0.5157 0.2917 0.3889]
       Units: 'normalized'

  Use GET to show all properties
If you have a child you can always get its parent in a similar way.
sub1.Parent
ans =

  Figure (1) with properties:

      Number: 1
        Name: ''
       Color: [1 1 1]
    Position: [0.3536 0.5157 0.2917 0.3889]
       Units: 'normalized'

  Use GET to show all properties
In addition to the standard properties, information can also be stored within graphical objects using the "appData". This has a similar syntax to the "get" and "set" commands (was created and used before the new paradigm). To see all the entries in appData:
getappdata(fig)
ans =

  struct with fields:

    SubplotDefaultAxesLocation: [0.1300 0.1100 0.7750 0.8150]
              SubplotListeners: []
                  SubplotDirty: []
       SubplotListenersManager: [1×1 matlab.graphics.internal.SubplotListenersManager]
                   SubplotGrid: [2×1 Axes]
To create an entry (or modify an existing one):
setappdata(fig,'SomeProperty',42)
getappdata(fig)
ans =

  struct with fields:

    SubplotDefaultAxesLocation: [0.1300 0.1100 0.7750 0.8150]
              SubplotListeners: []
                  SubplotDirty: []
       SubplotListenersManager: [1×1 matlab.graphics.internal.SubplotListenersManager]
                   SubplotGrid: [2×1 Axes]
                  SomeProperty: 42
This can be used to define and set new properties for your specific figures.
To clear the appData use:
rmappdata(fig,'SomeProperty')