Large-scale 3D Graphics
This is a tutorial for creating 3D graphics of large data sets. In many cases when your data starts getting large, creating 3D graphics will take an extremely long time. Since in many cases the eye cannot tell between extremely resolved data and not as resolved data, to speed up rendering time you can "skip" through your data and only use a reduced number of points.
Contents
Create simple data
We begin by creating some sample 3D data.
x=linspace(-1,1,512);
y=linspace(-2,2,512);
z=linspace(-5,5,1024);
[xxx,yyy,zzz]=meshgrid(x,y,z);
myf=sin(pi*xxx.*yyy).*(yyy.^2-3*xxx.*yyy.*zzz);
xg=xxx;
yg=yyy;
zg=zzz;
fg=myf;
Naive plotting
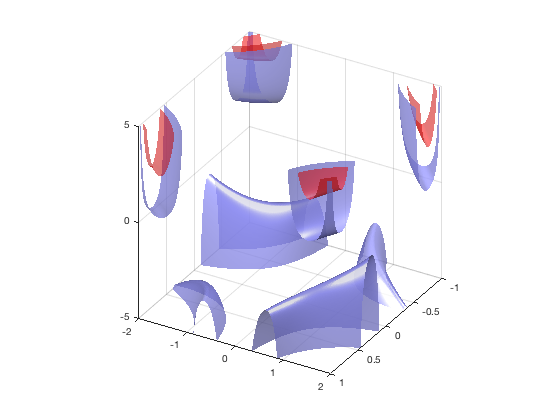
Plotting this normally, we see that it can take a long time.
figure(1)
clf
tic
p1=patch(isosurface(xg,yg,zg,fg,15));
p1.FaceColor = [0.95 0.05 0.05];
p1.EdgeColor = 'none';
p1.FaceAlpha = 0.55;
hold on
p2=patch(isosurface(xg,yg,zg,fg,5));
p2.FaceColor = [0.55 0.55 0.95];
p2.EdgeColor = 'none';
p2.FaceAlpha = 0.75;
view([120 30])
grid on
camlight(-45,0.1)
camlight(45,30)
daspect([1 2 5])
toc
Elapsed time is 64.704654 seconds.

Skipping points
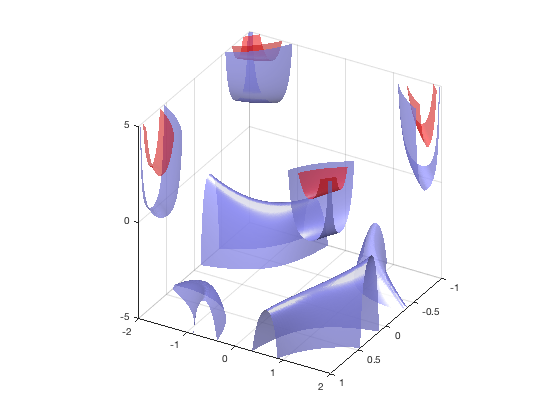
If we now only take and plot every other point, the graphics take substantially less time.
xskp=2;yskp=2;zskp=2;
xg=xxx(1:xskp:end,1:yskp:end,1:zskp:end);
yg=yyy(1:xskp:end,1:yskp:end,1:zskp:end);
zg=zzz(1:xskp:end,1:yskp:end,1:zskp:end);
fg=myf(1:xskp:end,1:yskp:end,1:zskp:end);
figure(2)
clf
tic
p1=patch(isosurface(xg,yg,zg,fg,15));
p1.FaceColor = [0.95 0.05 0.05];
p1.EdgeColor = 'none';
p1.FaceAlpha = 0.55;
hold on
p2=patch(isosurface(xg,yg,zg,fg,5));
p2.FaceColor = [0.55 0.55 0.95];
p2.EdgeColor = 'none';
p2.FaceAlpha = 0.75;
view([120 30])
grid on
camlight(-45,0.1)
camlight(45,30)
daspect([1 2 5])
toc
Elapsed time is 8.094981 seconds.

You should find that the second plot takes substantially less time to render. For me it went from 60s to 7s.
Other options
If this does not speed up your rendering time sufficiently, other options that may help are: Turn the GraphicsSmoothing property 'off' (fig.GraphicsSmoothing = 'off') Ensure that Matlab is using your graphics card (if you have one) and that it is using the latest drivers. To see this information type: close all opengl hardware opengl info opengl software opengl info Other more specific improvements can be found at: https://www.mathworks.com/help/matlab/graphics-performance.html