Exporting Figures
This tutorial explores how to save your figures and export them.
Contents
Create data to export
Let's begin by creating a figure we want to export. We will use a 3D isosurface, since this is the most complicated type of graphics you can have in Matlab, all the functions used here will work for other plots unless otherwise specified.
Make grid.
x=linspace(-1,1,256);
y=linspace(-2,2,256);
z=linspace(-5,5,512);
[xxx,yyy,zzz]=meshgrid(x,y,z);
Make data.
myf=sin(pi*xxx.*yyy).*(yyy.^2-3*xxx.*yyy.*zzz);
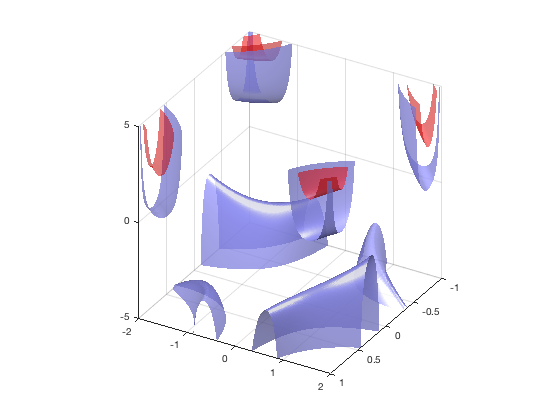
Draw isosurfaces (isosurface only works in 3D). As well as change various parameters to look better in the exported version. Eg. adding the grid.
fig=figure(1);
clf
tic
p1=patch(isosurface(xxx,yyy,zzz,myf,15));
p1.FaceColor = [0.95 0.05 0.05];
p1.EdgeColor = 'none';
p1.FaceAlpha = 0.55;
hold on
p2=patch(isosurface(xxx,yyy,zzz,myf,5));
p2.FaceColor = [0.55 0.55 0.95];
p2.EdgeColor = 'none';
p2.FaceAlpha = 0.75;
view([120 30])
grid on
camlight(-45,0.1)
camlight(45,30)
daspect([1 2 5])
toc
Elapsed time is 7.667540 seconds.
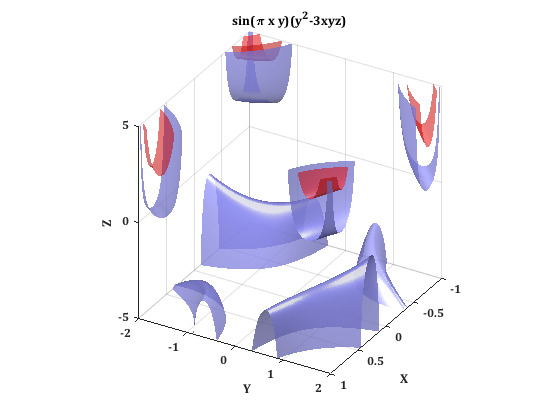
Adding Features
Before exporting you may want to add features such as a title, axis titles, change the font, etc...
title('sin(\pi x y)(y^2-3xyz)')
xlabel('X')
ylabel('Y')
zlabel('Z')
cur_ax=gca;
cur_ax.FontName='Cambria';
cur_ax.FontSize=12;
cur_ax.FontWeight='bold';
To see a full list of the properties which you can change to customize your plot go to: https://www.mathworks.com/help/matlab/ref/axes-properties.html?searchHighlight=axis%20properties&s_tid=doc_srchtitle.
Printing
Once you are happy with the appearance of your figure, we can use the "print" function to export. The general usage for print is: print(figure,filename,format,format options) This will export your figure, "figure", to a file called "filename" in the format "format" into the current directory. For example:
print(fig,'Fig1.jpeg','-djpeg')
% This exports your figure to a jpeg.

In general there are two types of image files, Bitmap Images and Vector Graphics Images. Bitmaps store your image as pixels at a certain resolution which means that they do not scale well, however they are generally smaller in size. Vector Graphics store the information on how to redraw the figure, which results in better scaling figures however they are generally larger.
The most common Bitmap Image type is jpeg (-jpeg). JPEGs achieve their smaller size by compressing the image, and thus losing image quality. In general most JPEG algorithms will compress by a factor of 1:10. The most common Vector Graphics type is the pdf (-pdf). The most important print options is "-r#" which can specify the resolution in dpi (digital pixel inches) (number of pixels per inch).
print(fig,'Fig2.jpeg','-djpeg','-r500')

When printing to pdf it uses the Paper* properties of the figure and thus need to be set to create a good figure.
fig.PaperUnits = 'inches';
fig.PaperSize = [8.5 11];
fig.PaperPosition = [0 0 8.5 11];
print(fig,'Fig3.pdf','-dpdf','-r500')
