Solving the 3D wave equation
This scripts solves the 3D wave equation using the FFT. It also illustrates how to create nice 3D graphics.
Contents
close all;clear;
Create the grid
N=64;
z=linspace(-1,1,N+1);
z=z(1:end-1);
[xx,yy,zz]=meshgrid(z,z,z);
Parameters.
dt=0.001;
L=2;
dk=2*pi/L;
Wavenumbers
ksvec(1)=0;
ksvec(N/2+1)=0;
for ii=2:(N/2)
    ksvec(ii)=ii-1;
    ksvec(N/2+ii)=-N/2 + ii -1;
end
ksvec=ksvec*dk;
[k,l,m]=meshgrid(ksvec,ksvec,ksvec);
k2=k.*k; l2=l.*l; m2=m.*m;
Create the operators
lap=-(k2+l2+m2);
myop=dt*dt*lap;
Create the ICs
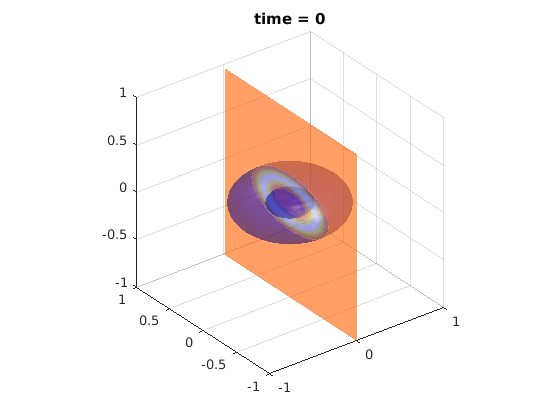
r=sqrt(xx.*xx+yy.*yy+4*zz.*zz);
u0 = exp(-((r-.4)/.1).^2);
u=u0;
um1=u0;
Time parameters
numsteps=100; numouts=10; t=0;
Plot ICs
figure(1)
clf
hold on
p=patch(isosurface(xx,yy,zz,u,0.05));
set(p,'FaceColor','blue','EdgeColor','none','facealpha',.3)
daspect([1 1 1])
view(3); camlight, lighting phong
sl = slice(xx,yy,zz,u,0,[],[]);
minc = max(min(u(:)),-1);
maxc = min(max(u(:)),1);
cbot = -abs(max(abs(minc),abs(maxc)));
ctop = -cbot;
caxis([cbot ctop]);
colormap hot;grid on %colorbar
set(sl,'edgecolor','none','facecolor','interp','ambientstrength',1,...
    'diffusestrength',0,'specularstrength',0,'facealpha',0.6);
mystr=['time = ' num2str(t)];
title(mystr);
axis([-1 1 -1 1 -1 1])
drawnow
Main Loop
for ii=1:numouts
for jj=1:numsteps
Step time.
t=t+dt;
FFT in y.
uf=fft(u);
FFT in x.
uf=fft(uf,[],2);
FFT in z.
uf=fft(uf,[],3);
Make the laplacian piece.
uf=myop.*uf;
iFFT in y.
uf=ifft(uf);
iFFT in x.
uf=ifft(uf,[],2);
iFFT in z.
uf=ifft(uf,[],3);
Knock off the small imaginary parts.
uf=real(uf);
Take a leapfrog step forward.
        up1=-um1+2*u+uf;
        um1=u;
        u=up1;
end
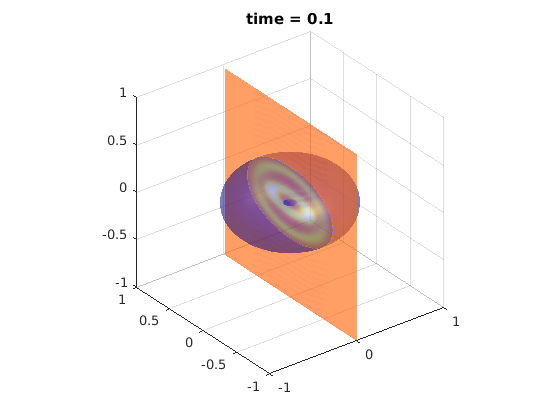
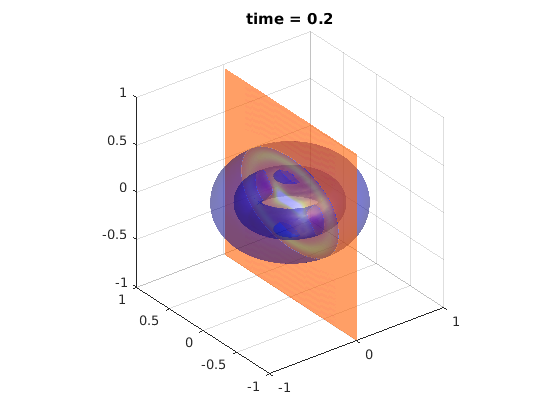
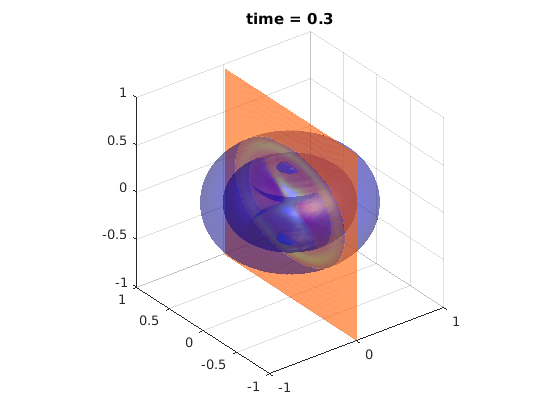
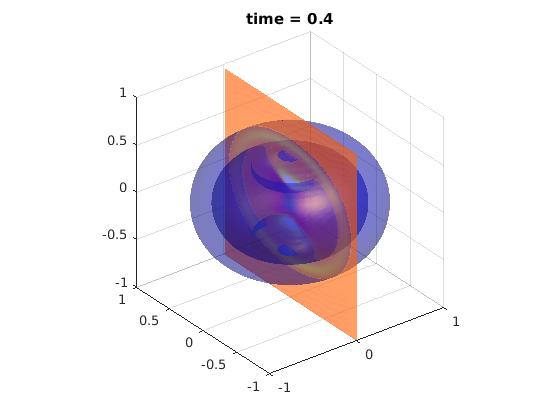
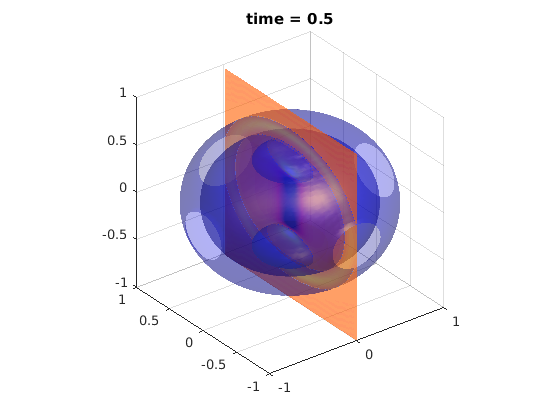
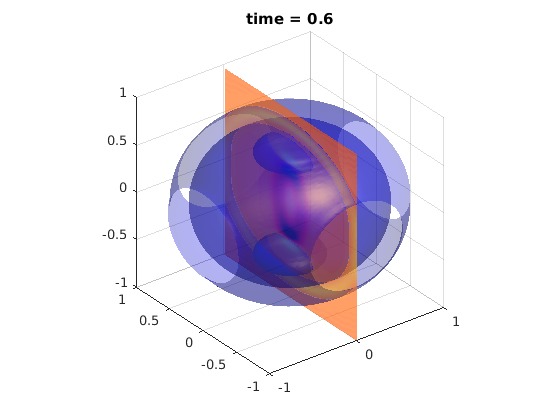
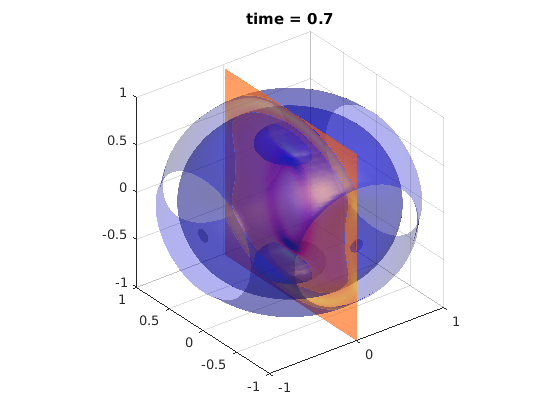
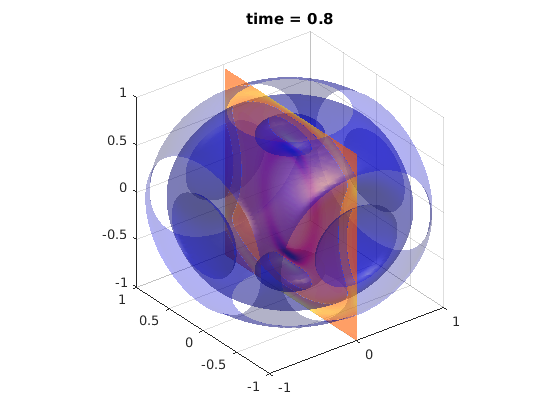
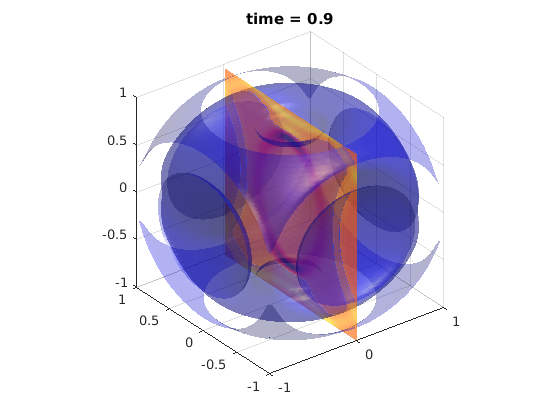
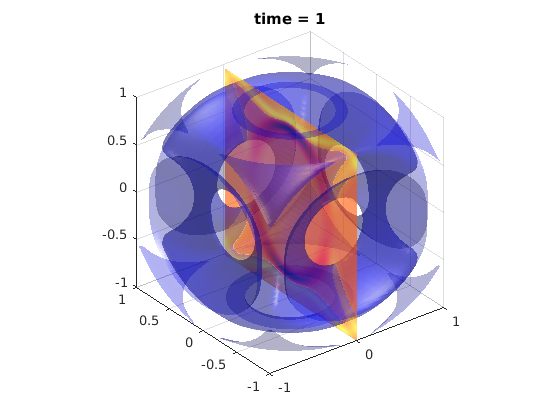
Step plot
    figure(1)
    clf
    hold on
    p=patch(isosurface(xx,yy,zz,u,0.05));
    set(p,'FaceColor','blue','EdgeColor','none','facealpha',.3)
    daspect([1 1 1])
    view(3); camlight, lighting phong
    sl = slice(xx,yy,zz,u,0,[],[]);
    minc = max(min(u(:)),-1);
    maxc = min(max(u(:)),1);
    cbot = -abs(max(abs(minc),abs(maxc)));
    ctop = -cbot;
    caxis([cbot ctop]);
    colormap hot;grid on %colorbar
    set(sl,'edgecolor','none','facecolor','interp','ambientstrength',1,...
        'diffusestrength',0,'specularstrength',0,'facealpha',0.6);
    mystr=['time = ' num2str(t)];
    title(mystr);
    axis([-1 1 -1 1 -1 1])
    drawnow
end