Available Potential Energy: Difference between revisions
No edit summary |
No edit summary |
||
| Line 1: | Line 1: | ||
[[File:APE_explanation.jpg]] | [[File:APE_explanation.jpg|thumb|right|400px|<!-- Caption here -->]] | ||
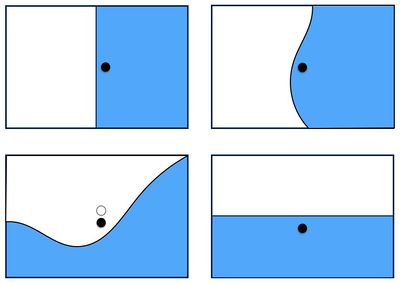
The blue | To understand the idea of available potential energy (APE), consider the figure on the right. The blue areas indicate regions of high density, while the white areas denote lower density fluid. The black dote depicts the centre of mass of each system. If the system is free to adjust from the upper-left panel, the difference in density will lead to the gravity wave motion in the second and third panels. The motion is caused by the conversion of potential energy into kinetic energy. In the third panel, the white dot shows the original location of the centre of mass. The final panel shows how the center of mass has been lowered, and a minimum configuration of potential energy has been achieved. While the final state still contains potential energy, it is not available to be converted into kinetic (or other forms of) energy, and so the final rest state has zero APE. | ||
Latest revision as of 15:17, 2 June 2015

To understand the idea of available potential energy (APE), consider the figure on the right. The blue areas indicate regions of high density, while the white areas denote lower density fluid. The black dote depicts the centre of mass of each system. If the system is free to adjust from the upper-left panel, the difference in density will lead to the gravity wave motion in the second and third panels. The motion is caused by the conversion of potential energy into kinetic energy. In the third panel, the white dot shows the original location of the centre of mass. The final panel shows how the center of mass has been lowered, and a minimum configuration of potential energy has been achieved. While the final state still contains potential energy, it is not available to be converted into kinetic (or other forms of) energy, and so the final rest state has zero APE.