File:Curvefitting-rex2.png

Size of this preview: 600 × 600 pixels. Other resolution: 688 × 688 pixels.
Original file (688 × 688 pixels, file size: 11 KB, MIME type: image/png)
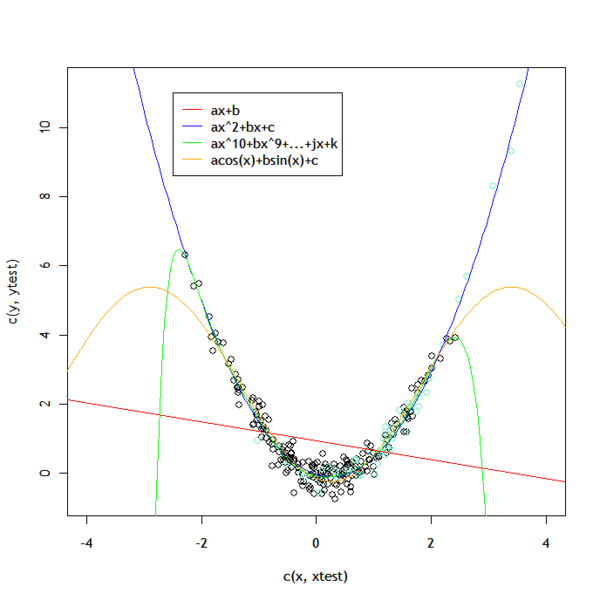
Fitting degree 1, 2, and 10 polynomials, and trigonometric functions to a randomly generated quadratic sample.
Black points represent training data, teal represent test data. Y values follow the same function, but x values of training and test data have means 0 and 1 to help separate them.
File history
Click on a date/time to view the file as it appeared at that time.
| Date/Time | Thumbnail | Dimensions | User | Comment | |
|---|---|---|---|---|---|
| current | 17:24, 8 November 2009 | | 688 × 688 (11 KB) | Njmurdoc (talk | contribs) | Fitting degree 1, 2, and 10 polynomials, and trigonometric functions to a randomly generated quadratic sample. Black points represent training data, teal represent test data. Y values follow the same function, but x values of training and test data have |
You cannot overwrite this file.
File usage
The following page uses this file: