Learning to Navigate in Cities Without a Map
Paper: Learning to Navigate in Cities Without a Map[1]
A video of the paper is available here[2].
Introduction
Navigation is an attractive topic in many research disciplines and technology related domains such as neuroscience and robotics. The majority of algorithms are based on the following steps.
1. Building an explicit map
2. Planning and acting using that map.
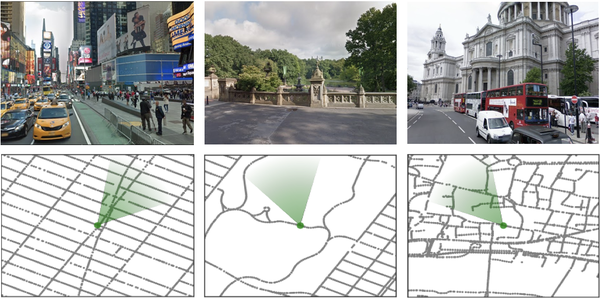
In this article, based on this fact that human can learn to navigate through cities without using any special tool such as maps or GPS, authors propose new methods to show that a neural network agent can do the same thing by using visual observations. To do so, an interactive environment using Google StreetView Images and a dual pathway agent architecture are designed. As shown in figure 1, some parts of environment are built using Google StreetView images of New York City (Times Square, Central Park) and London (St. Paul’s Cathedral). The green cone represents the agent’s location and orientation. Although learning to navigate using visual aids is shown to be successful in some domains such as games and simulated environments using deep reinforcement learning (RL), it suffers from data inefficiency and sensitivity to changes in environment. Thus, it is unclear whether this method could be used for large-scale navigation. That’s why it became the subject of investigation in this paper.

Related Works
Contribution
This paper has made the following contributions.
1. Designing a dual pathway agent. This agent can through a real city.
2. Using Goal-dependent learning. This means that the policy and value functions must adapt themselves to a sequence of goals that are provided as our input.
3. Leveraging a recurrent neural architecture. Using that, not only could navigation through a city be possible, but also the model is scalable for navigation in new cities.
4. Using a new environment which is built on top of Google StreetView. This provides real-world images for agent’s observation. Using this environment, agent should navigate from an arbitrary starting point to a goal and then to another goal etc. Also, London, Paris, and New York City are chosen for navigation.
Environment
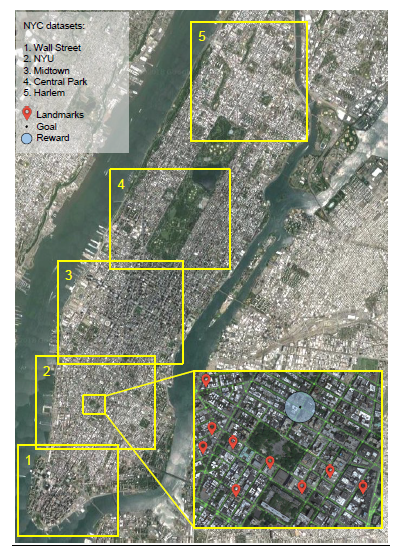
Google StreetView consists of both high-resolution 360 degree imagery and graph connectivity. Also, it provides a public API. These features make it a valuable resource. In this work, large areas of New York, Paris, and London that contain between 7,000 and 65,500 nodes (and between 7,200 and 128,600 edges, respectively), have a mean node spacing of 10m, and cover a range of up to 5km chosen (Figure 2), without simplifying the underlying conncections. Also, the agent only sees RGB images that are visible in StreetView images (Figure 1).

Agent Interface and the Courier Task
In RL environment, we need to define observations and actions in addition to taks. Xt and gt are inputs. Also, a first person view of 3D environment is simulated using cropped 60 degree square RGB image that is scaled to 84*84 pixels. Furthermore, the action space consists of 5 movements: “slow” rotate left or right (±22:5), “fast” rotate left or right (±67.5), or move forward.
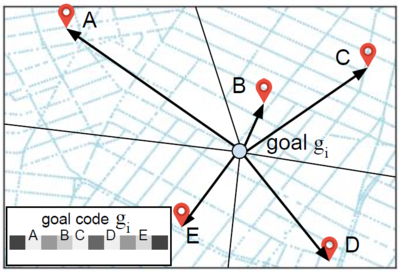
There are lots of ways to specify the goal to the agent. In this paper, the current goal is chosen to be represented in terms of its proximity to a set L of fixed landmarks [math]\displaystyle{ L={(Lat_k, Long_k)} }[/math] which is specified using Latitude and Longitude coordinate system. For distance to the [math]\displaystyle{ k_{th} }[/math] landmark [math]\displaystyle{ {(d_{(t,k)}^g})_k }[/math] the goal vector contains [math]\displaystyle{ g_{(t,i)}=\tfrac{exp(-αd_{(t,i)}^g)}{∑_k exp(-αd_{(t,k)}^g)} }[/math]for [math]\displaystyle{ i_{th} }[/math] landmark with [math]\displaystyle{ α=0.002 }[/math] (Figure 3).

This form of representation has 2 advantages:
1. It could be extended to new environments easily.
2. It is intuitive. Even humans and animals use landmarks to be able to move from one place to another.
In this work 644 landmarks for NewYork, Paris, and London is manually defined. Furthermore, in each episode,which consists of 1000 steps, the agent starts from a random place with random orientation. when agent gets within 100 meter of goal, the next goal is randomly chosen. Finally the goal is proportional to the shortest path between agent and goal.
Methods
In this paper, the learning problem is based on Markov Decision Process, with state space S, action space A, environment Ɛ, and a set of possible goals G. The reward function depends on the current goal and state: [math]\displaystyle{ R: S×G×A → R }[/math]. maximize the expected sum of discounted rewards starting from state [math]\displaystyle{ s_0 }[/math] with discount Ƴ.