Music Recommender System Based using CRNN: Difference between revisions
| Line 16: | Line 16: | ||
==Methods and Techniques:== | ==Methods and Techniques:== | ||
Generally, a music recommender can be divided into three main parts: (I) users, (ii) items, and (iii) user-item matching algorithms. First, we generated users' music tastes based on their profiles. Second, item profiling includes editorial, cultural, and acoustic metadata were collected for listeners' satisfaction. Finally, we come to the matching algorithm that suggests recommended personalized music to listeners. | |||
To classify music, the original music’s audio signal is converted into a spectrogram image. Using the image and the Short Time Fourier Transform (STFT), we convert the data into the Mel scale which is used in the CNN and CRNN models. | |||
=== Mel Scale: === | === Mel Scale: === | ||
Scale of pitches that are heard by listeners, which translates to equal pitch increments. | Scale of pitches that are heard by listeners, which translates to equal pitch increments. | ||
Revision as of 18:04, 28 November 2020
Introduction and Objective:
In the digital era of music streaming, companies, such as Spotify and Pandora, are faced with the following challenge: how to provide users with relevant and personalized music recommendations amidst the ever-growing abundance of music and user data.
The objective of this paper is to implement a personalized music recommender system that takes user listening history as input and continually finds new music that captures individual user preferences.
The authors of this paper argue that a music recommendation system should vary from the general recommendation system used in practice since it should combine music feature recognition and audio processing technologies to extract music features, and combine them with data on user preferences.
The authors of this paper took a content-based music approach to build the recommendation system - specifically, comparing the similarity of features based on the audio signal.
The following two-method approach to building the recommendation system was followed:
- Make recommendations including genre information extracted from classification algorithms.
- Make recommendations without genre information.
The authors used convolutional recurrent neural networks (CRNN), which is a combination of convolutional neural networks (CNN) and recurrent neural network(RNN), as their main classification model.
Methods and Techniques:
Generally, a music recommender can be divided into three main parts: (I) users, (ii) items, and (iii) user-item matching algorithms. First, we generated users' music tastes based on their profiles. Second, item profiling includes editorial, cultural, and acoustic metadata were collected for listeners' satisfaction. Finally, we come to the matching algorithm that suggests recommended personalized music to listeners.
To classify music, the original music’s audio signal is converted into a spectrogram image. Using the image and the Short Time Fourier Transform (STFT), we convert the data into the Mel scale which is used in the CNN and CRNN models.
Mel Scale:
Scale of pitches that are heard by listeners, which translates to equal pitch increments.

Short Time Fourier Transform (STFT):
Transformation that determines the sinusoidal frequency of the audio, with a Hanning smoothing function.
Convolutional Neural Network (CNN):
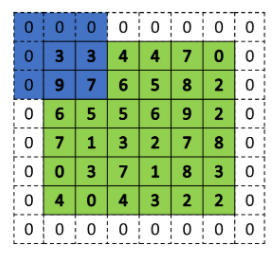
Neural Network that uses convolution in place of matrix multiplication for some layer calculations. By training the data, weights for inputs are updated to find the most significant data relevant to classification. These convolutional layers gather small groups of data and with kernels, and try to find patterns that can help find features in the overall data. The features are then used for classification. Padding is also used to maintain the data on the edges.

Convolutional Recurrent Neural Network (CRNN):
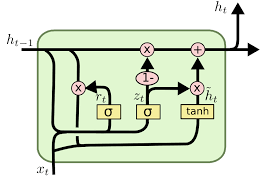
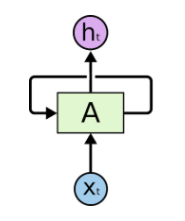
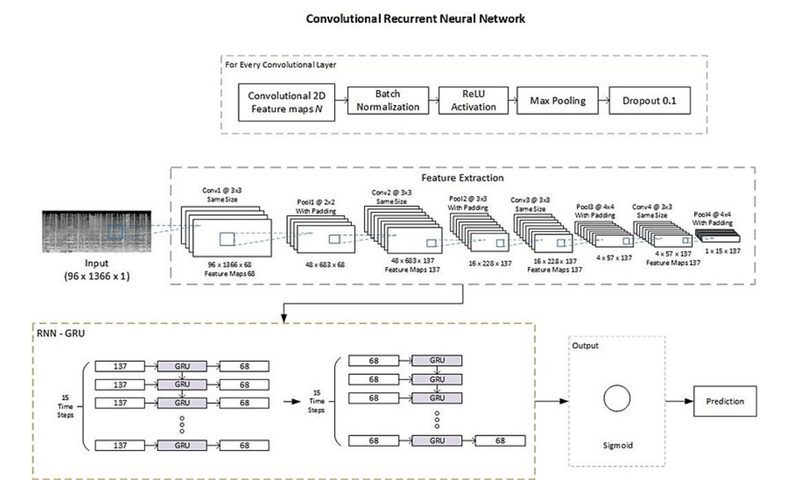
Similar Neural Network as CNN, with the addition of a GRU, which is a Recurrent Neural Network (RNN). A RNN is used to treat sequential data, by reusing the activation function of previous nodes to update the output. A Gated Recurrent Unit (GRU) is used to store more long-term memory and will help train the early hidden layers.
Data Screening:
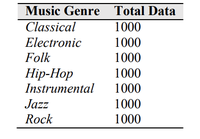
The authors of this paper used a publicly available music dataset made up of 25,000 30 second songs from the Free Music Archives. To ensure a balanced dataset, only 1000 songs each from the genres of classical, electronic, folk, hip-hop, instrumental, jazz and rock were used in the final model.
Implementation:
Modeling Neural Networks
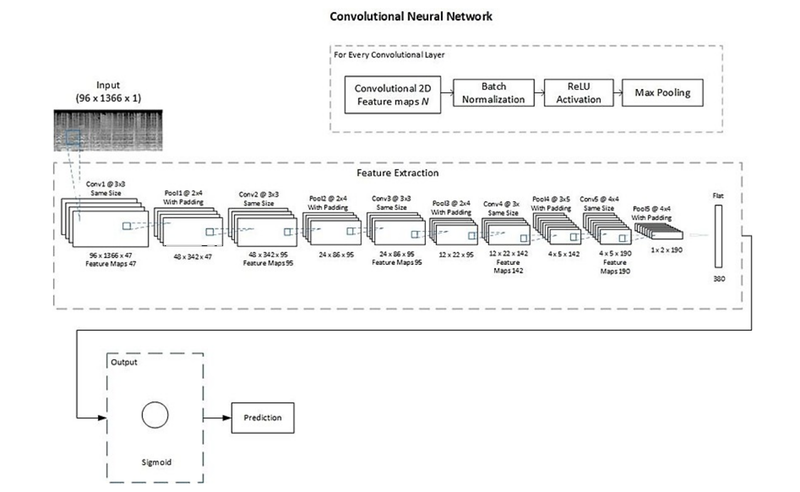
As noted previously, both CNNs and CRNNs were used to model the data. The advantage of CRNNs is that they are able to model time sequence patterns in addition to frequency features from the spectrogram, allowing for greater identification of important features. Furthermore, feature vectors produced before the classification stage could be used to improve accuracy.
In implementing the neural networks, the Mel-spectrogram data was split up into training, validation, and test sets at a ratio of 8:1:1 respectively and labelled via one-hot encoding. This made it possible for the categorical data to be labelled correctly for binary classification. As opposed to classical stochastic gradient descent, the authors opted to use Adam optimization to update weights in the training phase. Binary cross-entropy was used as the loss function.
In both the CNN and CRNN models, the data was trained over 100 epochs with a binary cross-entropy loss function. The sigmoid function was used as the output layer.
An overview of the CNN and CRNN architecture can be found in the charts below.
Music Recommendation System
The recommendation system is computed by the cosine similarity of the extraction features from the neural network. Each genre will have a song act as a centre point for each class. The final inputs of the trained neural networks will be the feature variables. The featured variables will be used in the cosine similarity to find the best recommendations.
The values are between [-1,1], where larger values are songs that have similar features. When the user inputs five songs, those songs become the new inputs in the neural networks and the features are used by the cosine similarity with other music. The largest five cosine similarities are used as recommendations.

Evaluation Metrics
Precision:
- The proportion of True Positives with respect to the predicted positive cases (true positives and false positives)
- For example, out of all the songs that the classifier predicted as Classical, how many are actually Classical?
- Describes the rate at which the classifier predicts the true genre of songs among those predicted to be of that certain genre
Recall:
- The proportion of True Positives with respect to the actual positive cases (true positives and false negatives)
- For example, out of all the songs that are actually Classical, how many are correctly predicted to be Classical?
- Describes the rate at which the classifier predicts the true genre of songs among the correct instances of that genre
F1-Score:
An accuracy metric that combines the classifier’s precision and recall scores by taking the harmonic mean between the two metrics:

Receiver operating characteristics (ROC):
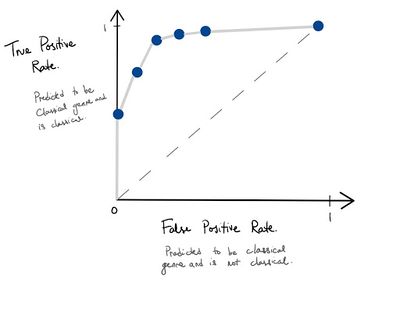
- A graphical metric that is used to assess a classification model at different classification thresholds
- In the case of a classification threshold of 0.5, this means that if [math]\displaystyle{ P(Y = k | X = x) \gt 0.5 }[/math] then we classify this instance as class k
- Plots the true positive rate versus false positive rate as the classification threshold is varied
Area Under the Curve (AUC)
AUC is the area under the ROC in doing so, the ROC provides an aggregate measure across all possible classification thresholds.
In the context of the paper: When scoring all songs as [math]\displaystyle{ Prob(Classical | X=x) }[/math], it is the probability that the model ranks a random Classical song at a higher probability than a random non-Classical song.

Results
Accuracy Metrics
Looking at the accuracy metrics at the classification threshold of 0.5:
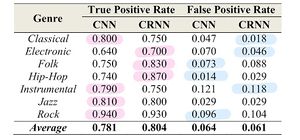
On average, CRNN outperforms CNN in true positive and false positive cases

On average, CRNN outperforms CNN in F1-score

On average, CRNN also outperforms CNN in AUC metric
CRNN models that considers the frequency features and time sequence patterns of songs have a better classification performance through metrics such as F1 score and AUC when comparing to CNN classifier.
Evaluation of Music Recommendation System:
- A listening experiment was performed with 30 participants to access user responses to given music recommendations.
- Participants choose 5 preferred music and the recommender system gives 5 recommendations; the participants evaluated the music recommendation by recording whether the song was liked or disliked.
- The recommendation system takes two approach to recommendation:
- Method one uses only the value of cosine similarity
- Method two uses the value of cosine similarity and information on music genre
- Perform test of significance of differences in respondents to the two methods using t-statistic

Comparing the two methods, [math]\displaystyle{ H_0: u_1 - u_2 = 0 }[/math], we have [math]\displaystyle{ t_{stat} = -4.743 \lt -2.037 }[/math] which concludes that the addition of a music genre information increases -- it is statistically significant
Conclusion:
To increase the predictive capabilities of the music recommendation system, song genre should be a key feature. To extract the song genre from a song’s audio signals, CRNN’s are superior to CNN’s as they consider frequency in features and time sequence patterns of audio signals.
Critiques/ Insights:
- The authors fail to give reference to the performance of current recommendation algorithms used in industry; my critique would be for the authors to bench-mark their novel approach with other recommendation algorithms such as collaborative filtering to see if there is lift in predictive capabilities.
- The listening experiment used to evaluate the recommendation system only includes songs that are outputted by the model. Users may be biased if they believe all songs have come from a recommendation system. To remove bias, we suggest to have 15 songs where 5 songs are recommended and 10 songs are set. With this in the user’s mind it may remove some bias in response and give more accurate predictive capabilities.
- They could go into more details about how CRNN makes it perform better than CNN, in terms of attributes of each network.
- The methodology introduced in this paper is probably also suitable for movie recommendation. As music is presented as spectrograms (images) in a time sequence, and it is very similar to a movie.
- The way of evaluation is a very interesting approach. Since it's usually not easy to evaluate the testing result when it's subjective. By listing all these evaluations' performance, the result would be more comprehensive.
- The paper lacks the comparison between the proposed algorithm and the music recommendation algorithms being used now. It will be clearer to show the superiority of this algorithm.
- The GAN neural network has been proposed to enhance the performance of the neural network, so an improved result may appear after considering using GAN.